How Does The Stochastic Indicator Work For Trading?
Your Stochastics journey doesn't have to be hard! There are a few things to know, and you will be all set when it comes to this momentum indicator! Here's how to leverage the stochastic indicator to use stock momentum in your favor.


The stochastic oscillator, also famously termed the stochastic indicator, is a technical analysis tool useful in predicting a series of trend reversals. This is primarily used because it becomes easier to identify any overbought and oversold levels. These levels can be inclusive of shares, currencies, and other assets.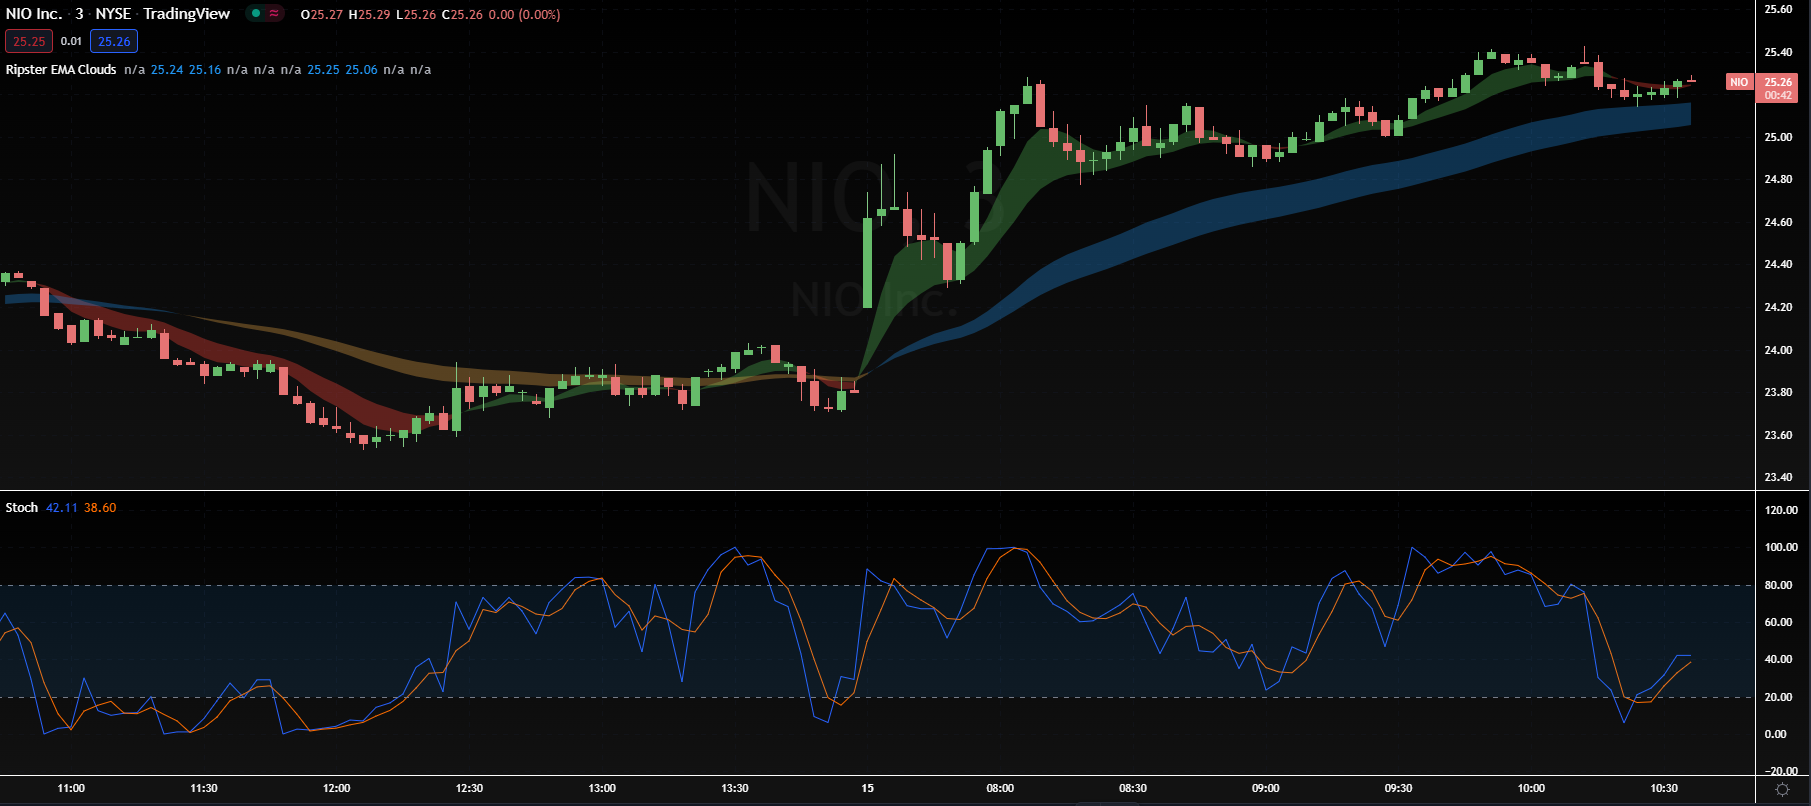
The stochastic indicator is known for its ability to measure price movement by taking into consideration the price action that exists. For traders, using this technical indicator can ease trading sessions tremendously, as it uses moving averages, the price chart, and trendlines to make measurements more precise. Hence, as a result of the stochastic oscillator, you will be able to improve your accuracy when identifying the overbought or oversold region, the most recent closing price, and all the other latest price movements as well.
Now that we have provided you with a brief introduction let us take this discussion further up a notch and tell you how it works!
How do you use the Stochastic Indicator?
The stochastic oscillator measures by focusing on any instrument's closing price location. This will, of course, be derived after its highest and lowest prices have been identified. Hence, comparing the last closing price to the previous price movement will give you an idea of the trading range and predict any price reversal points.
Another thing to denote regarding this momentum indicator is that it has two lines. The two lines will give you an idea of the highest and lowest security's price over a predetermined period. You can also consider it a tool that gives you an insight into the past performance of how well an instrument has been performing on financial markers.
So in layman's words, the stochastic oscillator forms by measuring the current price by looking at the highest price and the lowest market price in a specific past period.
This then brings us to another vital question which is:
How do you interpret the Stochastic Oscillator?
When the stochastic lines are anywhere above 80, then this is telling you that the instrument is aligning with overbought conditions. If the stochastic is less than 20, then the momentum indicator is signaling oversold conditions. A general stochastic oscillator formula, which we follow here, is %K=(H14−L14C−L14)×100.
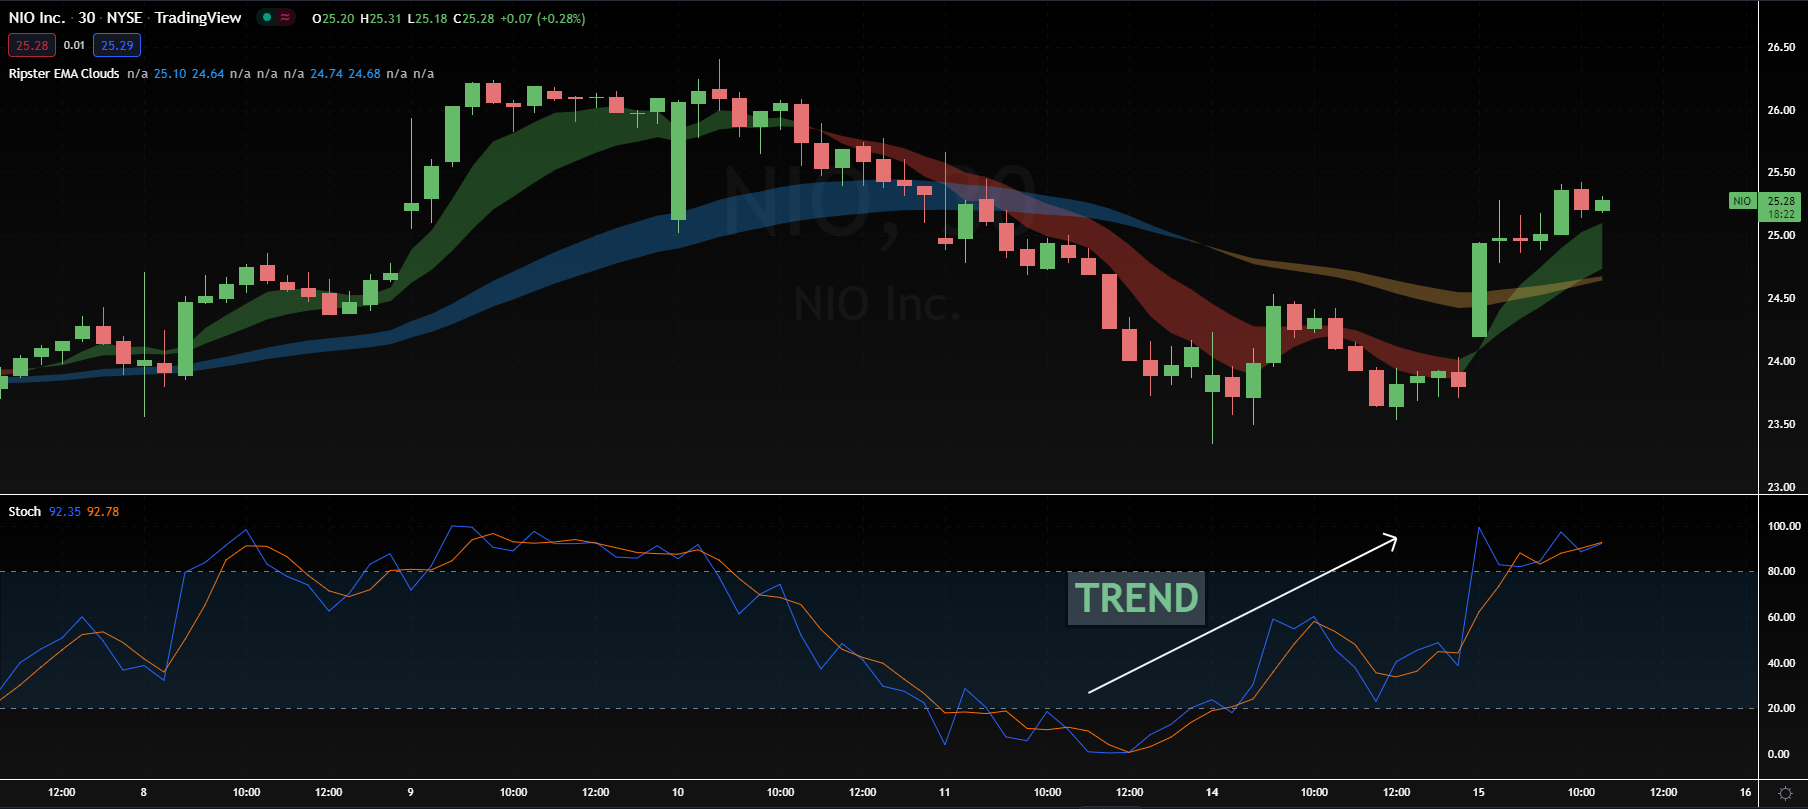
As a trader, a worry that can arise is not to fall prey and let the stochastic oscillator generate false signals over a time period. For this, you have to be highly prudent and check the trendline of the price movements. If the buy signal is such that the current trendline is moving away from one another, then the price formations may weaken.
Before we further progress with the article, let us put forth a few technical terms for you, which you need to be aware of!
Dissecting a few vital terms in the realm of the Stochastics Momentum Indicator!
A few terminologies which will ease your stochastics journey by a great degree are:
A Bullish Divergence:
A bullish divergence occurs when there is the lowest price recorded, but the condition is that the stochastic oscillator is able to form a higher low. This shows that the downside momentum is less, which could've otherwise signaled a bullish reversal.
Bearish Divergence:
Bearish divergence forms when the price can record its highest high, but on the other hand, the stochastic oscillator can form a lower high. This showcases an upward momentum, which is, in turn, foreshadowing a bearish reversal.
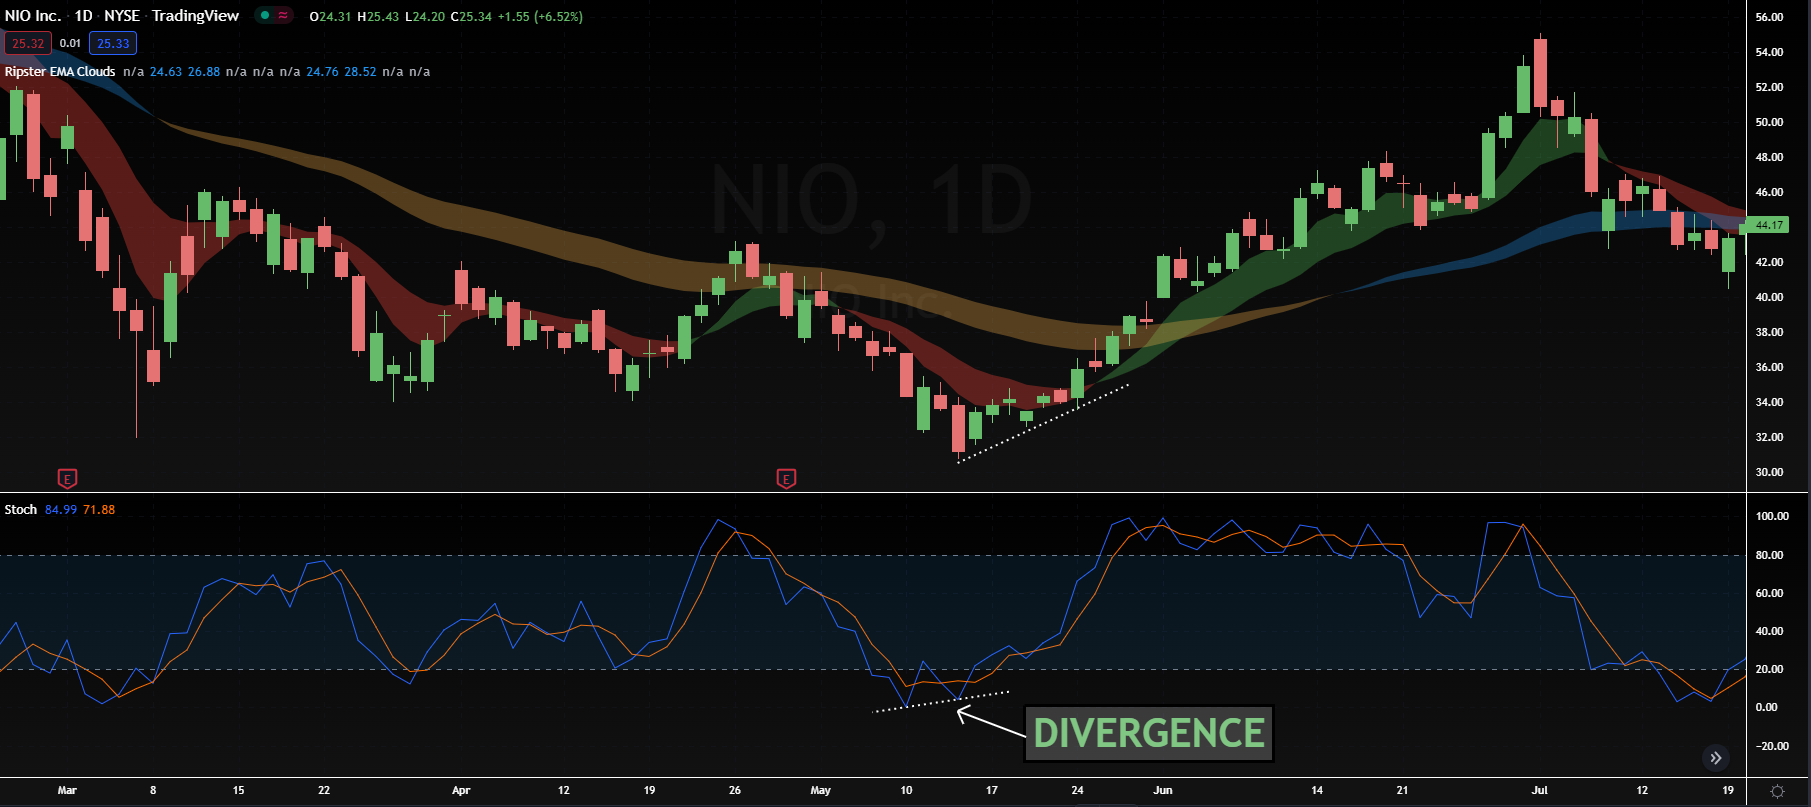
For traders, once an established trend has been made, it is easier to confirm what stochastic divergence is likely to take place. If, for instance, the stochastic oscillator is somewhere below 50, then bearish divergences will form. However, if the broad trading ranges break on any level greater than 50, then bullish divergence forms instantaneously!
Slow Stochastic Oscillator:
Now you have to understand that any transaction signals will only be created when the k line is able to cross the three-period moving average (%D).
Keeping this in mind, a Slow Stochastic oscillator is where there are slow-moving trends of the moving average of k in three years.
Fast Stochastic Oscillator:
A Fast Stochastic oscillator is driven by two periods, namely: a smoothing parameter and a lookback time period. The price trend here is usually smoothened out.
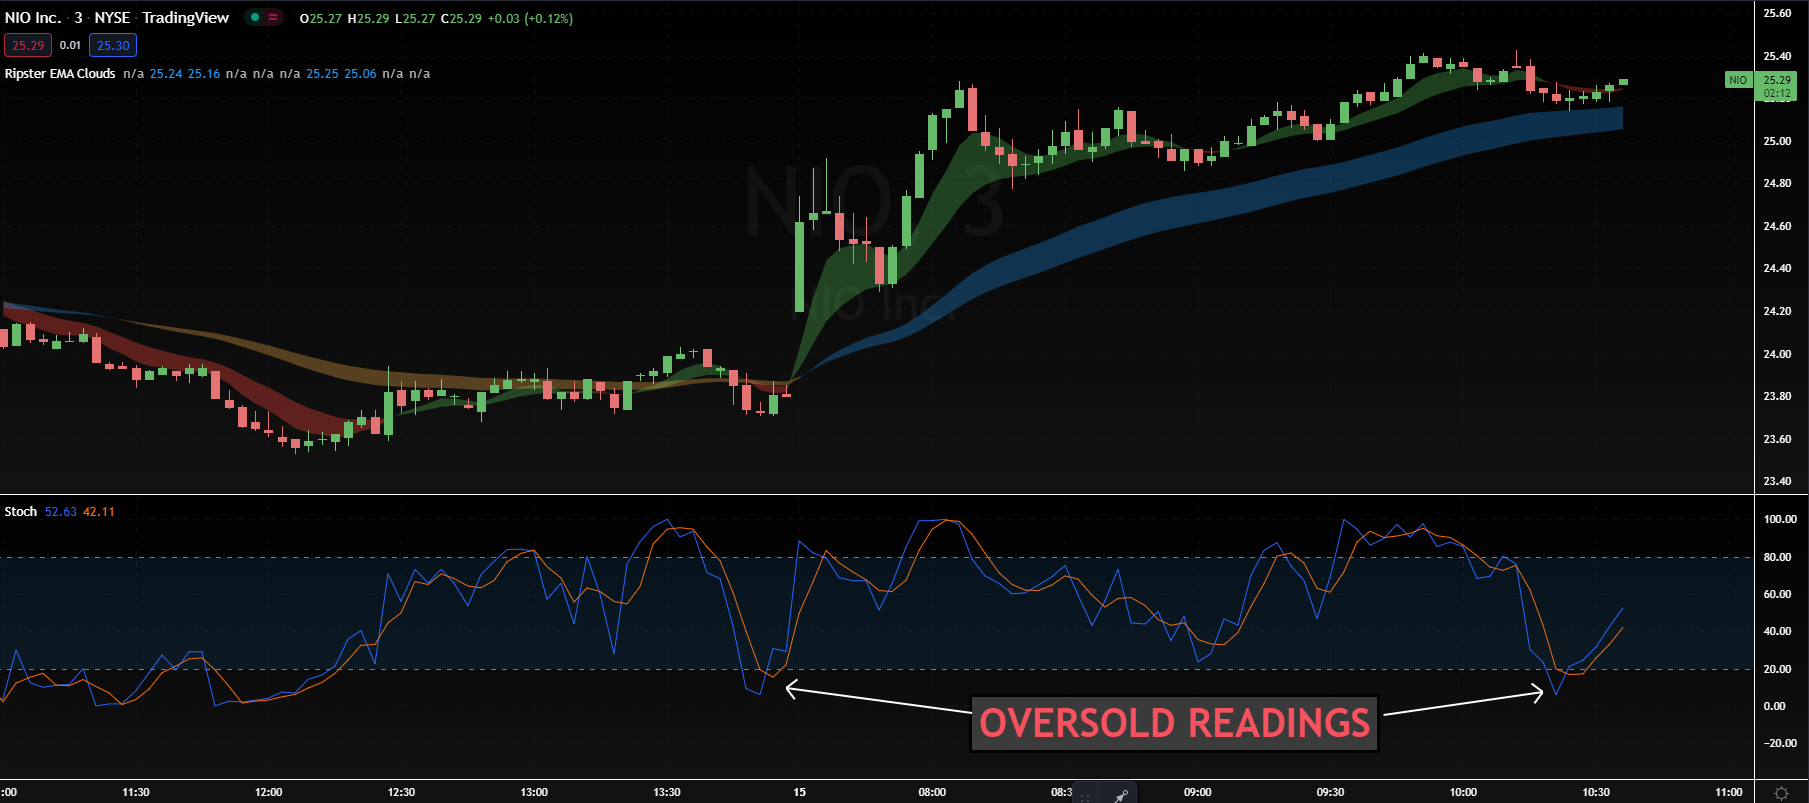
Overbought and oversold conditions:
For a stochastic oscillator to deliver technical analysis, what you need is to understand the overbought and oversold levels. To identify overbought levels, look for the readings- anything over an 80 is overbought.
On the other hand, an indication of oversold readings is looking out for the number 20. If the stochastic oscillators are signaling a number 20, the market is oversold!
Closing price in technical analysis:
Lane was the genius behind the stochastic oscillator, and the concept behind this was to identify the price action movement - particularly that of the most recent closing price.
Hence, if we are to give you a description of the closing price in the simplest words, then it is the value on which the latest transaction has taken place before the market ends up closing for normal trading. This can be the lowest price or even a high one.
The objective is that it gives trading signals to other trading enthusiasts to engage in stochastics via technical analysis, and of course, by understanding the sell signal and certain overbought and oversold conditions.
The K and D:
The blue line in the stochastic indicator is also the fast stochastic, known as the %k line.
Next up is the red line, which is famously referred to as the %D line, and this technical indicator is useful for a three-year time period moving average.
Now that we have familiarized you with a few terms, let's assess:
Can I employ the Stochastic Oscillator with other technical analysis indicators?
You can! Our personal favorite in this regard is the moving averages because they are able to complement any crossover signals given through the Oscillator.
You also have the option of the MACD, which too is a viable indicator alongside the Stochastic Oscillator.
Another one is the RSI, which can make it slightly easier to keep track of price movements and other factors when used with the Stochastic Indicator.
Who can use the Stochastic Oscillator?
This indicator can be used by anyone who has a knack for trading and is either a professional or an experienced trader trying to make their mark in the world of trading. The benefit is that with this oscillator, you can keep track of your trading ventures, any success that you have incurred, and of course, tailor-make it to your liking.
Due to the fact that the Stochastic Oscillator has to be constantly tailor-made to your trading conditions, it can become nothing short of a treat to test it. You can see what will eventually work for you and what doesn't, and you are free to modify it at any time of the day as you please. Hence, you won't be restricting yourself to a specific way of trading, and you will be able to explore all that you can do when you are on the platform trading and simultaneously rolling in thousands of green notes!
Of course, we advise you here to be patient, as results overnight are not guaranteed. Lastly, to put it out there, we are not financial advisors! Whatever we say is solely contingent upon our experience and what has worked for us. Please do conduct your research so that you can be sure that you are making an informed choice before embarking on this field.
What are the benefits of Stochastic Indicators?
There are a lot of benefits that you will be able to reap with the Stochastic oscillator by your side. They are:
Ease of entry and exit signals:
With the aid of the stochastic oscillator, you can make your technical analysis a whole lot easier by identifying the sell signal, exit signals, and entry signals seamlessly.
Frequent signals:
In comparison to other technical indicators, the stochastic oscillator is beneficial in providing frequent trading signals in a certain time period.
Overbought and Oversold conditions:
With the stochastic indicator, the technical analysis of the trading range becomes better. The reason is that the trader will be able to look at the oversold readings and simultaneously identify overbought levels as well, which will ultimately lead to maximum gains and limited losses.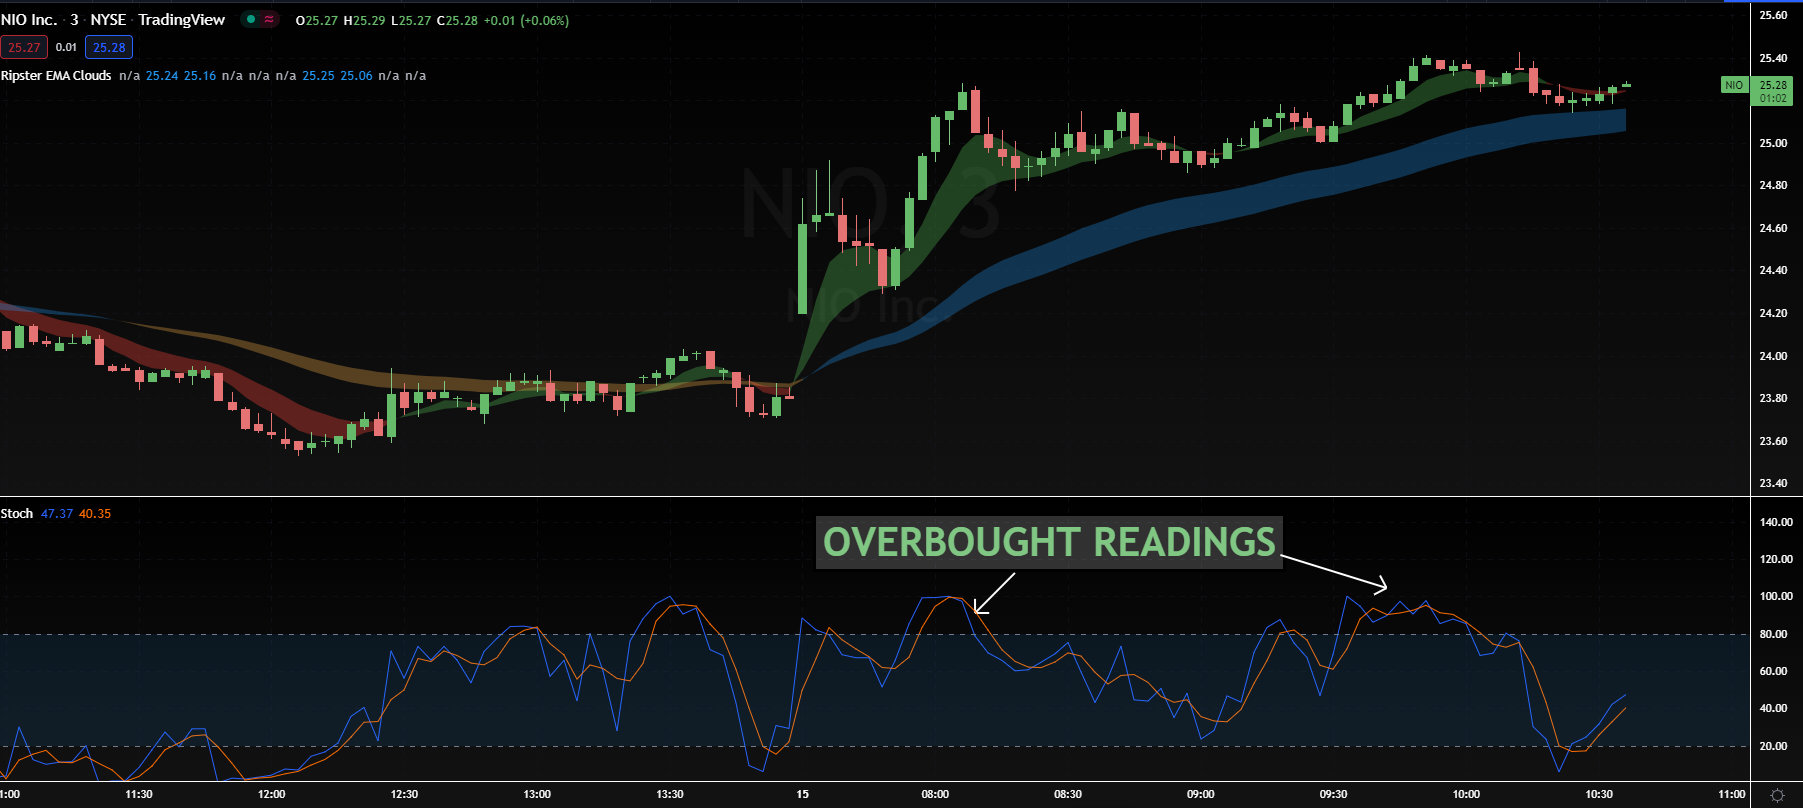
Easy to understand:
Another benefit of the stochastic oscillator is that it is easier to understand. If you get your facts straight regarding things such as the k line and where the k line crosses and where it doesn't;t the moving average and know what your overbought or oversold conditions are, then there is nothing that you need to be worried about!
With a few ideas, such as the slow stochastic and trend reversals on the tip of your tongues, your stochastics game will be as easy as eating a slice of pie!
What are a few limitations of the Stochastic Oscillator?
There is perhaps only one, and we briefly shed light upon it before. If you are not careful with the stochastic indicator, it can produce false signals. The issue arises when you are able to detect a trading signal that is generated, but which isn't true, as the market price doesn't follow it. If this continues, then you could seriously end up losing a lot of money.
Therefore, in light of the above, our advice is that you should always be double-checking trading signals, and your market's conditions, before solely relying on the stochastics indicator to get you through.
There is a potential risk like this associated with any of your indicators, which is why you have to have a good grasp of financial markets to make sure that you know what you're doing. This debate then brings us all onto the most crucial questions which arise today regarding stochastics measures, which is:
Is the Stochastic Oscillator worth a shot?
It most definitely is!

It is because it makes it relatively better to understand your present market conditions and what you can do to earn more profits. When used with other indicators, it works wonders in boosting your wealth, imparting you with knowledge, and making interpretation regarding the current market status quo more efficacious.
Moreover, there is no potential harm attached with this either, which is why we suggest that you do give it a go and see how well it works for you.
The Bottom Line: A Stochastic Oscillator is a Miraculous tool in the world of Trading!
To conclude, the stochastic indicator is your best friend when it comes to identifying a plethora of factors. For instance, if you need help in others and an oversold Stochastic oscillator, then all you have to do is strive to look for any break above 20. Conversely, if the aim is to trade a security in the overbought region, then take the help of the stochastic indicator, and look to break below 80. This will signal a downturn!
In addition to the above, when it comes to other momentum indicators in place, you can qualify the stochastic indicator as a leading one because it considers all market conditions to produce the most accurate results possible!
However, something which we suggest that you do is that you base this oscillator on your personal preferences and your preferred trading style. The reason is that you ultimately have to make the decisions, and if you aren't careful, then they may not be in your favor.
Hence, when looking to trade in a specific time frame, make sure that everything is tailor-made to suit your trading style.
Lastly, do feel free to utilize the stochastic oscillator with other tools if you wish, such as moving averages to deliver more accurate results.
Having said the above, we hope that you had fun reading this informative piece on Stochastics, as we did in crafting it for you!
See you next time!
Matt.
Note: Please understand that we are not financial advisors. Market Moves is an LLC formed with the devotion and the commitment of many brilliant individuals. What we say is from our personal experience; it does not guarantee the same results for you. However, feel free to learn, and if you do implement our strategies, then do so at your own risk.
FAQs:
Some FAQs which our audience often tends to ask us are:
What is meant by support and resistance levels in Stochastics?
If you use the stochastic after understanding the science around support and resistance levels, then things can seriously get way easier! The support price is used to prevent the price movement from regularly falling. It assists it in getting back up!
If you talk about the resistance levels, then that is used to ensure that the price doesn't dip back down and remain stable in the long run.
What is the Stochastic RSI?
This technical analysis identifies a high low range between 0 and 100. The purpose of such a high low range is to reflect market conditions quickly.
Is the Stochastic indicator good?
Owing to the fact the stochastic oscillator is accurate, it is preferred by individuals all across the globe. It is popular for its swift delivery in illuminating the financial markets with great ease.
What is the best indicator to use alongside the Stochastic Oscillator?
In our opinion, the moving averages work exceptionally well with this indicator.
We say this because they can complement the crossover of any trade signals and make it easier for all the traders out there to carry out their trading endeavors.
Is the Stochastic Oscillator a leading indicator?
Yes, it is.
Due to the accuracy that it can deliver in its result, the stochastic oscillator has been classified by many as a leading indicator rather than a lagging one. The results are exceptionally curated to match your business, and you can easily set the oscillator as you please.
Trade with us!
If you're looking for a more sophisticated and educational options trading experience, look no further than "Market Moves Premium Options Trading Group." Our exclusive 7-day membership offers swing trading set-ups, fast text signals, and +100 hours of educational content. Plus, you'll have access to live trading sessions twice per day. So if you're ready to take your options trading to the next level, join us today!
Financial Disclaimer: Market Moves LLC is a company that provides education in financial and stock market literacy. WE ARE NOT FINANCIAL ADVISORS. In fact, it is illegal for us to provide any financial advice to you. Under U.S. law, the only persons who can give you financial advice are those who are licensed financial advisors through the SEC. Results shown from Market Moves LLC or customers who use our product and/or service are individual experiences, reflecting real-life experiences. These are individual results, and results do vary. Market Moves LLC does not claim that they are typical results that consumers will generally achieve. Past performance does not guarantee future results. You should not rely on any past performance as a guarantee of future investment performance