An Ultimate Guide to Reversal Candlestick Patterns
Financial trading is a standard investment method but is not as easy as it seems. However, you can make it easy with reliable and practical tools. Reversal candle patterns are powerful tools to monitor trading and make market analysis straightforward. They are helpful in options, crypto, and stock trading because the market makes sudden trends that result in a significant loss on the trader's side.

Many types of reversal candle patterns help traders know prime moments in the market. Their patterns can be utilized in trading strategies to make beneficial moves. Therefore, this article aims to analyze essential candlestick patterns and their use. Let's explore.
What are Reversal Candlestick Patterns?
It is believed that the Japanese formed candlestick patterns for rice trading. Over time, these patterns made their way to the trading world. It is formulated in such a way to indicate the end of an existing trend while benefiting the opposite one.
These appealing candlestick patterns are visual aids that help the trader analyze market trends regarding a particular stock or option.
Traders can conveniently see the market sentiments and when the sentiment might be shifting. It makes complex trading easy even for beginners.
How can you use the Candlestick Reversal Pattern?
The financial market is always present in a state of constant motion. You can witness stocks fluctuating every time during the day. The candlestick reversal patterns are helpful tools for identifying the way of fluctuation.
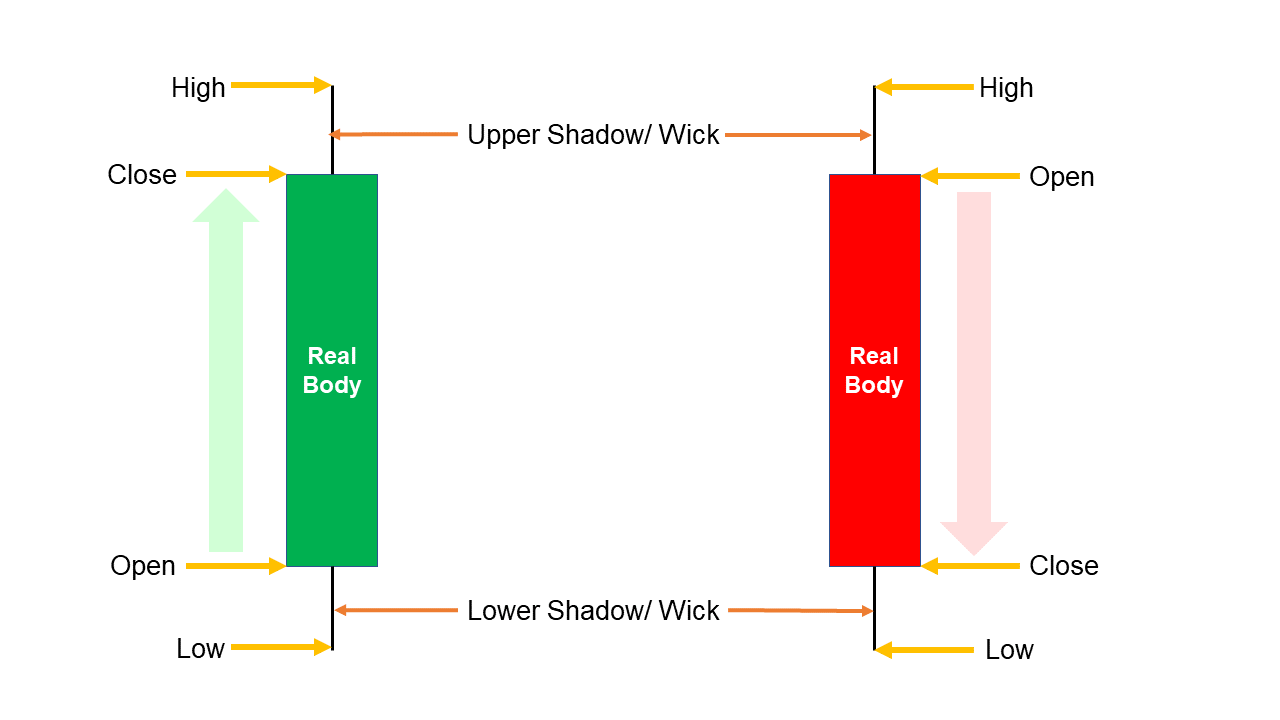
In the picture you can see the basics of a candlestick made up of a high, low, close, and open.
The high and low help traders know the magnitude of the range while the open and close tell the meaningful levels for the move. Altogether the candlestick paints a picture on whether a stock will move up, down, or sideways based on the relationship of these four variables!

Difference Between Bullish and Bearish Reversal Patterns
The bullish reversal patterns form at the bottom of trends on a chart and leads to a market shifts from a downtrend to an uprising trend.
Conversely, the bearish candlestick reversal occurs at the top of trends and leads to a market move from an uprising trend to a downtrend.
There are two factors that also help in differentiating both patterns.
The first factor is the pattern's shape. The sequence or arrangement of the candles contributes to formulating the shape of some patterns feature large candles while other small bodies and large lower of upper shadow.
Secondly, the location of the pattern within the trend also distinguishes the reversal pattern.
Technical Analysis for Successful Trading
Traders will always look for multiple pieces of confirmation to give themselves a higher chance of a winning trade. Therefore these patterns will not guarantee success and will work better when there are other pieces of evidence to support a reversal possibility.
Here are some ideas to combine with bullish candlestick analysis.
Support:
Try to get a bullish reversal at the support levels to increase authenticity. The support level is generally calculated with moving averages, trend lines, and former reaction lows.
Momentum:
Momentum is hard to determine, so utilize oscillators to confirm improving momentum with the bullish reversal. Optimal turns in RSI, PPO, etc., will increase strength and enhance the reversal pattern's momentum.
Money Flow:
It utilizes volume-based indicators to approach the pressure of buying and selling. On balance, volume, CMF, and accumulation are also usable in conjugation with the bullish candlestick pattern. The increasing strength of any of these will help the robustness of a reversal.
Top Bullish Reversal Candlestick Pattern
These bullish candlestick patterns are the most popular for many traders because of their back-tested probability of success. For any pattern to make this list the win rate must be over 60-70%.
When traders can achieve a possibility of profit better than a coin flip, they have an opportunity to be profitable only with good risk to reward scenarios.
These setups will guarantee success but by having a risk to reward over 1:3, this allows traders to have one winning trade account for 3 losing trades. Add in the pattern's win rate, now traders can have a better chance to succeed long term.
Bullish Engulfing Pattern
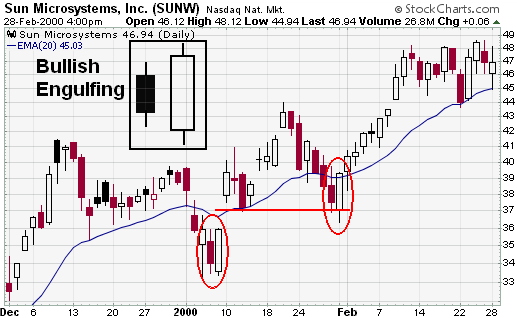
Bullish engulfing candlestick is a commonly spotted pattern consisting of two candlesticks. It contains a black candlestick pattern in the first place and a white in the second candle, which will be easily engulfed. The first candle should be doji. Its size does not matter a lot. Conversely, the second candle is supposed to be white and long. The bigger it will be, the more bullish reversal patterns it will be.

The white candlestick in this bullish pattern needs to be totally engulfed by the black candle's body. Sometimes, the white candle engulfs the shadow too. However, the shadows are allowed because they have a small sizes and generally are non-existent.
After a sudden decrease in value, the other white bullish candlestick will start forming when selling pressure causes the security to open before the previous closing prices.
The role of the buyer starts after the open and pushes prices above the previous open for a robust finish and potentially short-term interted. Usually, a larger white bullish candlestick results in greater bullish engulfing so that the inverted will be more bullish.
Bullish Harami
It contains only two candles but various matches. One candlestick has a significant body, while the other comprises a small body. Regardless of the bearish or bullish candlestick, all bullish Harami looks similar.

When Bullish Harami declines, it is considered a potential bullish reversal pattern. However, whether the first candle is black or white, the second candle of bullish harami will be smaller and more likely to reverse. In the case of the first Doji candle, the chances of a reversal harami increase.
The Harami formation that makes it unique from the morning Doji star is that after the first bearish candlestick forms, the second candle of harami pattern will move higher with the minimal body. Initially, the pattern might seem to consolidate, but actually, it indicates Harami pattern trend's sentiments, which are changing from lower to higher.
Piercing Pattern
Piercing line is another well-known bullish reversal candlesticks pattern. This pattern consists of two candlesticks which are black and white. For this pattern, both candles are supposed to have larger bodies as well as shadows. However, shadows can be compromised as they are not necessary.

In piercing line white candle opens at the end of the previous close. However, it closes almost above the center point of the black body. The closure of the white candlestick below the middle point might be considered a reversal but will not be bullish.
Similar to the bullish engulfing pattern, in this type, the selling pressure forces the security to open right down the former close. It shows that sellers still got the upper hand.
Anyhow, the buyer appears in the trade after the opening to push the security higher and ends above the midpoint of the former black body. More energy or strength is required to offer bullish candlestick confirmation to this kind of bullish engulfing pattern.
Bullish Abandoned Baby
This bullish reversal pattern resembles the morning Doji star. The bullish abandoned baby pattern consists of three candlesticks. The first candle is bearish and large. It appears in red, the second candle has a small body, and the third candlestick is large and bullish. these three candlesticks collectively form the meaningful trend of price.

The significant difference between an abandoned baby and the morning star is the gaps on both sides of the Doji. The first gap down tells that the selling pressure stays strong.
Anyhow the pressure of selling will ease, and the security closes at the open result in morning Doji star. After it, the gap and the extended bullish white candlestick white color show intense buying pressure, and the reversal is complete.
Inverse Hand and Shoulder
This bullish candlestick patter contains multiple candles. The first candle's body pattern generates the left shoulder when the initial price steps to a new low. A brief rally initiates, retracting a minimal portion of the downtrend.
Afterward, one more trend lowers from the head and pushes below the left shoulder. This trend is relieved by the rally that stalls close to the price point of the initial relief. These two points play a major role in creating the neckline.

Then the market corrects the lower another time which makes the right shoulder and maintains above the price down of the head. However, the candle pattern will follow robust rallies due to the period it takes to make this process.
Top Bearish Reversal Candlesticks Pattern
The bearish reversal candlesticks pattern is used to evaluate the pre-market reversals while transforming uptrends to downtrends. When the below-mentioned candlestick patterns form, they tell that the market is about to correct, and the trader can take action.
Here are some of the best and most highly observable bearish candlestick patterns.
Shooting Star Candlestick
As the name indicates, a shooting star is a single candle bearish pattern that appears at the end of an uptrend. This bearish pattern contains a minimal-sized candle with an extensive shadow on the upper side.

This formation is actually the result of prices rallying to new peaks at the candlestick opening. After that, the stock price, option, or crypto will reverse and can be seen on the candlestick chart.
It will go back to the original opening. The long shadow or wick on the upper side indicates that there is a robust batch of sellers as the market trades higher, but not very long.
Hanging Man Candlestick
It is another well-known bearish candlestick pattern. As the name indicates, its shape resembles a hanging man with a rope.

A bearish small body candle at the bottom and a long shadow at the bottom makes the entire candle pattern. When it comes to an understanding what it indicates, do not worry. Like its shape, it is easy.
The hanging man also looks like an inverted hammer. This pattern's opening and closing prices remain close with a lingering downside wick. However, the differentiating factor between both candle pattern is the location.
When it appears at the finishing point of the uptrend, it is regarded as a one of the bearish reversal patterns. However, it tells the trader that the lower or closing price might soon initiate. It is a kind of bearish engulfing pattern.
Dark Cloud Cover
This bearish reversal pattern is a two-candle candlestick formation. The first candle of dark cloud cover is strongly bullish, and the second body is a robust candle.

The crux of the bearish candle placement is that the second candlesticks will continue to push a new high, then the reverse lower. The second candlestick will end below the midpoint of the body of the first candle.
What should you do when Reversal Candles Form?
When a trader witnesses the bullish or bearish candle reversal trading pattern, a trader needs to determine the strength of the signal. However, here are a few guidelines for traders planning to initiate a new position on the side of a changing trend.
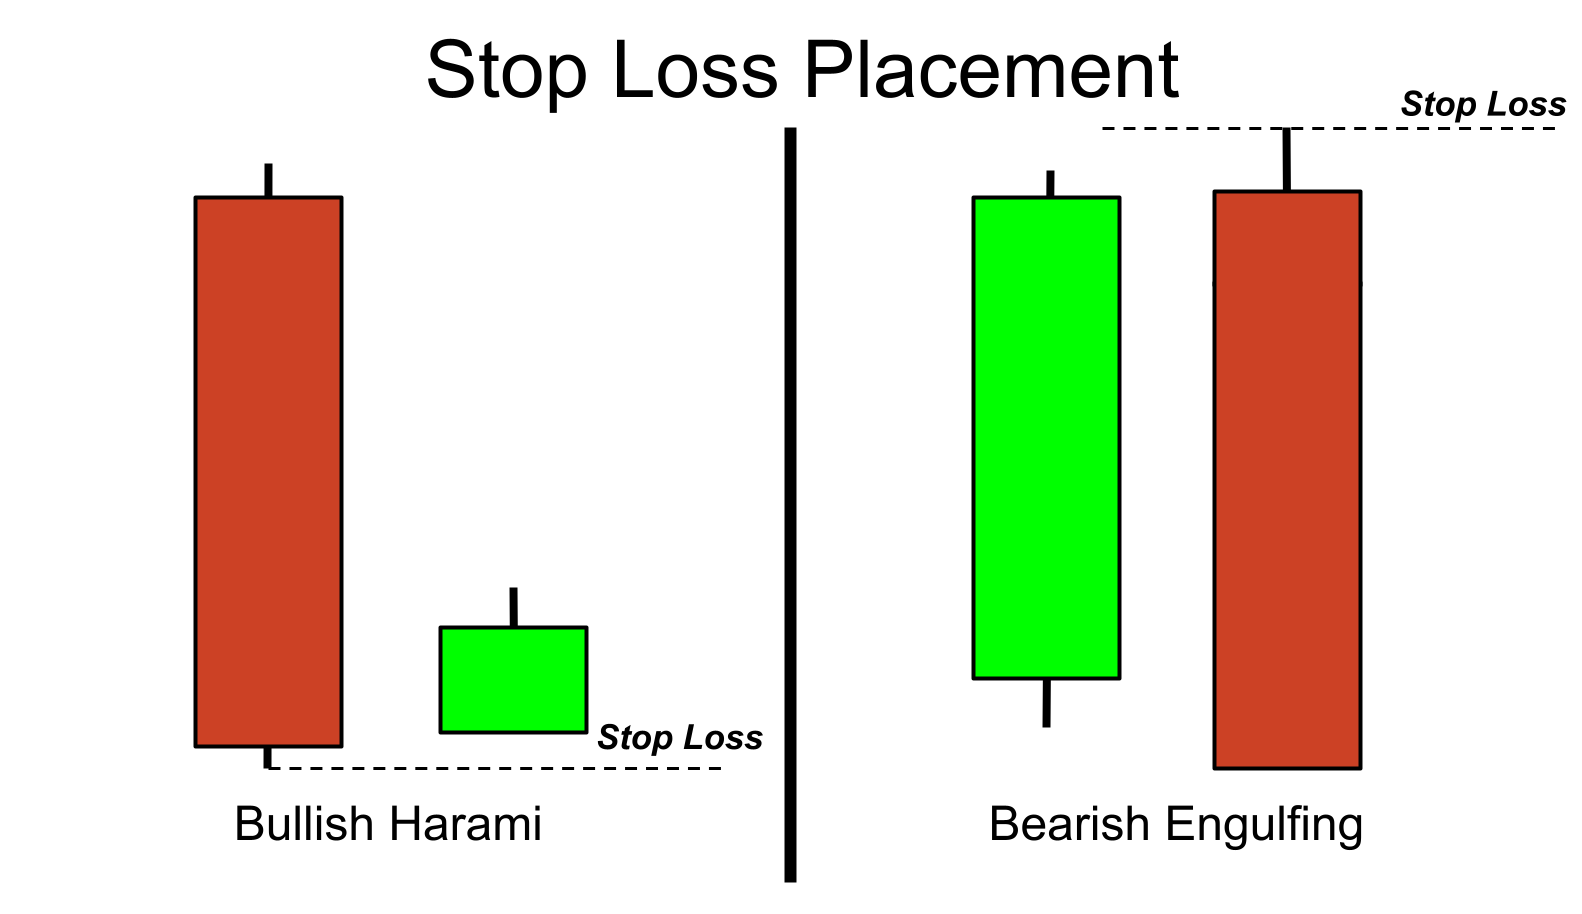
Stop loss: It is resting in order to close the position. It means selling the stock or option when the market moves against expectations.
When you see bullish reversal patterns, you will like to place the stop loss below the entire candle pattern . On the other hand, when the bearish reversal occurs, put your stop loss above the whole candle pattern.

Entry points: Generally, the candlestick pattern is single, dual, or triple. No matter what the number of candles is, the trader can step in the position in the direction of the reversal on the opening of the next candle when the pattern completes.
Take Profit: It is another resting order of candle body which becomes functional when the market moves in your favor. Set it at the twice the length or thrice distance from your entry to your stop loss.
Which Candlestick Pattern is more Reliable?
A reversal pattern of candle body does not directly show that the trend will change, nor does it mean it. However, the location of the candlestick pattern is crucial.
For instance, a bullish pattern in the middle of long consolidation does not mean that the consolidation will end, but the bullish reversal pattern at the end of an extensive bearish trend has a higher chance of leading to reversals.
Not all patterns ensure 100% success. Therefore, you should always manage the expected to current risk with a stop loss on every single bullish trade.
Final Verdict
Reversal candlestick patterns are potent tools that warn the trader about upcoming trends. However, the fact is that even these patterns have some limitations. It implies that the reliability of candlestick changes according to the market, time frame, and conditions.
Pattern shows the trend with placement of the body of the first candle and second candle. Yet, you can use these patterns as they help interpret the market's potential more strategically, such as a bullish and bearish engulfing pattern or a candlestick pattern.


![Webull Paper Trading Options [Complete Guide!]](https://tradewithmarketmoves.com/uploads/images/2022/05/image_380x226_6272b567442d8.jpg)


