What Is RSI Divergence?
What Is RSI Divergence? There are many technical analysis tools and indicators that traders use to help them make informed investment decisions. One of the most popular is the relative strength index- RSI. This indicator can be used to measure a security's momentum and determine whether it is overbought or oversold.


RSI Divergence is one of those subjects that can be difficult to understand, but traders and investors need to know what RSI divergence is and how it works. It measures the difference between two RSI values over a period of time. RSI divergence is calculated by taking the current RSI value and subtracting this from the previous RSI value.
RSI Divergence can help identify potential reversals or changes in momentum, leading to more accurate trades. This article will explore RSI Divergence and how it can be used as an effective trading indicator! Stay tuned!
What Is RSI Divergence?
RSI refers to the relative strength index, and divergence is between two RSI values in a defined period. RSI divergence is a technical analysis tool and momentum indicator that measures the difference between two RSI values over a period of time. It can help identify potential reversals or changes in momentum, leading to more accurate trades.
Take the current RSI value and subtract this from the previous RSI value to calculate RSI divergence. This will give you the difference between the two RSIs. You can then plot this information on a chart to see how it behaves over time.
RSI divergence can help identify bullish or bearish divergences, indicating a potential change in trend.
Positive and Negative Divergence in RSI :
Positive divergence occurs when the price of a security makes new lows, while RSI does not. This indicates that selling pressure is diminishing, and momentum may be slowing down. When there's positive divergence in an uptrend, it means the market has reached its lowest point and might reverse course to make higher highs. Conversely, if you see divergent negative values during a downward trend, this shows waning selling pressure, which can cause prices to rise or stay stable instead of continuing lower.
It's important to note that divergence is not a signal in and of itself but should be used along with other technical analysis tools to confirm or deny a potential trade. Always remember to use caution when trading!
The Concept of Bullish and Bearish Divergence
There are two types of RSI divergence: bullish and bearish. The most important thing to understand about these is that they occur in the opposite direction to each other.
What is Bearish Divergence?
A bearish divergence occurs when the RSI value decreases as the security increases. This is typically indicative of a reversal in trend and can be used to help traders enter into short positions.
The bearish divergence pattern is shown by two trendlines: one connecting the lows of the bullish candles and the other connecting the highs of the bearish candles. The space between these lines represents resistance that will need to be broken before the price can continue upwards.
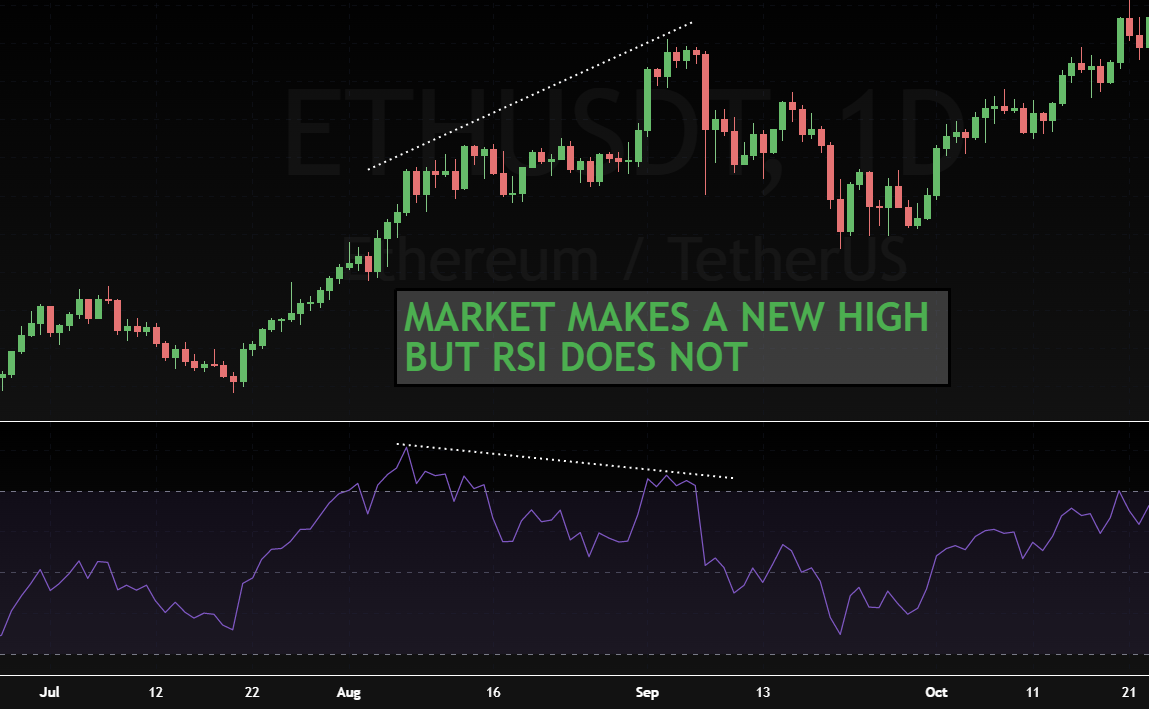
This chart shows an example of how bearish divergence can be used to predict a reversal in trend:

In this example, you can see that there a regular bearish divergence appears in strong uptrend until the price reached point A, at which time it started to decline. The RSI also declined during this time, which is where bearish divergence comes in. The RSI trendline was still pointing up, while the price trendline was starting to angle down towards it from above - this formed a bearish divergence pattern and indicated that a reversal would occur at point B. As expected, there was a sharp drop shortly after this time as well!
This can be an effective way for traders to predict when their holding period will come to an end so they can close out trades before losses become too large.
How to determine bearish divergence RSI?
Two main factors will affect RSI divergence: the length of time being measured and the security volatility. For example, a stock may have large daily swings but then move very little over weekly. It can mean less space between high and low price points for distances to grow compared with smaller-time frame readings, so bearish divergences on this chart could be more significant than those found in higher-resolution charts.
The other factor at play here has to do with momentum itself - it tends to increase as an asset becomes more volatile because traders are willing to pay increasingly more significant premiums for riskier assets. So when you're looking at shorter timeframe RSI measurements, particularly if prices are becoming even more volatile, divergence will tend to be more significant.
In general, you'll want to look for bearish divergences when the RSI is making higher highs, and the security's price is making lower lows. This indicates that selling pressure is increasing while buying pressure is decreasing, leading to a reversal in trend.
When looking at individual stocks or securities, it's essential to consider all of these factors in order to get an accurate reading on RSI divergence. You can then plot this information on a chart to see how it behaves over time!
What is Hidden Bearish Divergence?
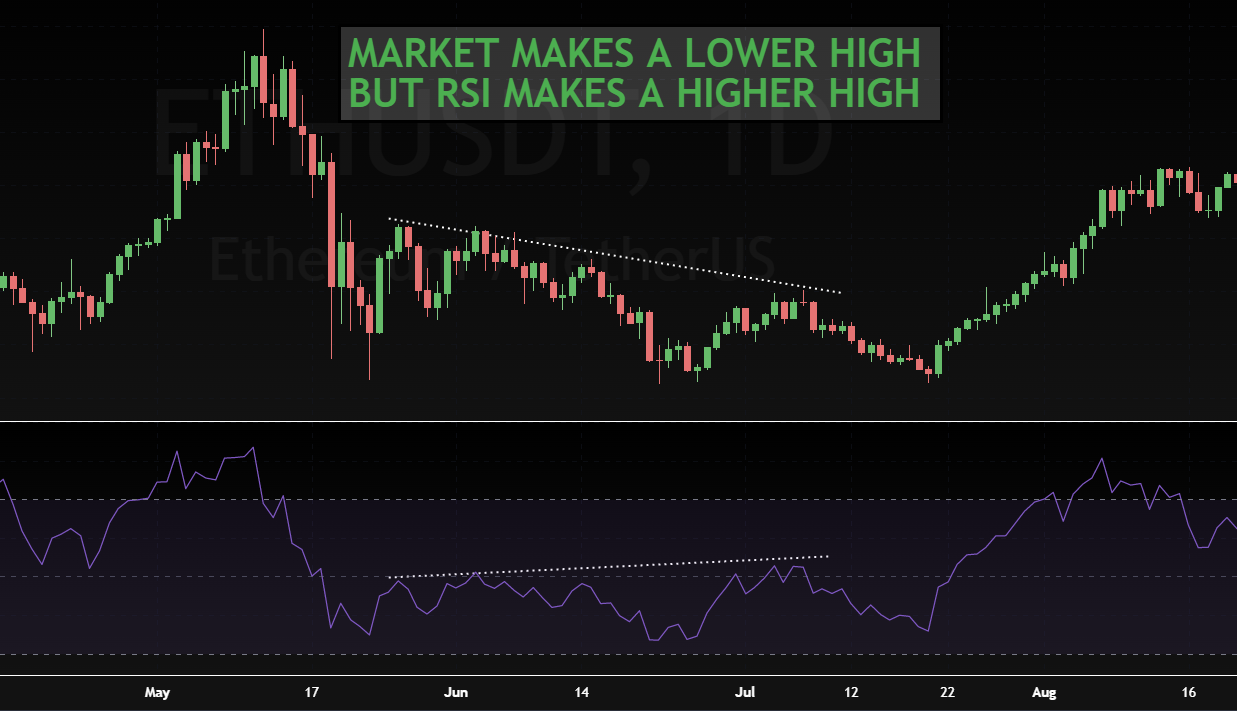
Hidden bearish divergence is a technical analysis term used to describe a situation where the price of a security is making higher highs while the RSI (relative strength index) is making lower highs. This typically indicates that the Bulls are losing control and that a reversal in trend may be imminent. As with all technical analysis indicators, bearish hidden divergence should not be used in isolation, but rather as part of a broader trading strategy.
For example, imagine you are observing an uptrend in stock and the price has been making higher highs while the RSI has also been trending higher. However, at some point, you notice that the RSI begins to make lower highs while the stock continues to push higher. This would be considered an early warning sign of a potential reversal and you may want to consider taking some profits or shorting the stock.
Keep in mind that hidden bearish divergence is not always accurate and should be used in conjunction with other technical indicators, such as price patterns, volume levels, and moving averages. By using a variety of tools, you can increase your chances of accurately predicting future price movements.
This chart shows an example of how hidden bearish divergence can be used to predict a reversal in trend:

Bullish Divergence RSI
Bullish divergence is a technical analysis term that describes when the price of an asset diverges from its RSI. This generally indicates that the asset is oversold and due for a rally. The opposite is also true; bearish divergence signals that the asset is overbought and likely to decline in price. It's important to note, however, that bullish and bearish divergence can occur in any market condition - not just when the trend is up or down.
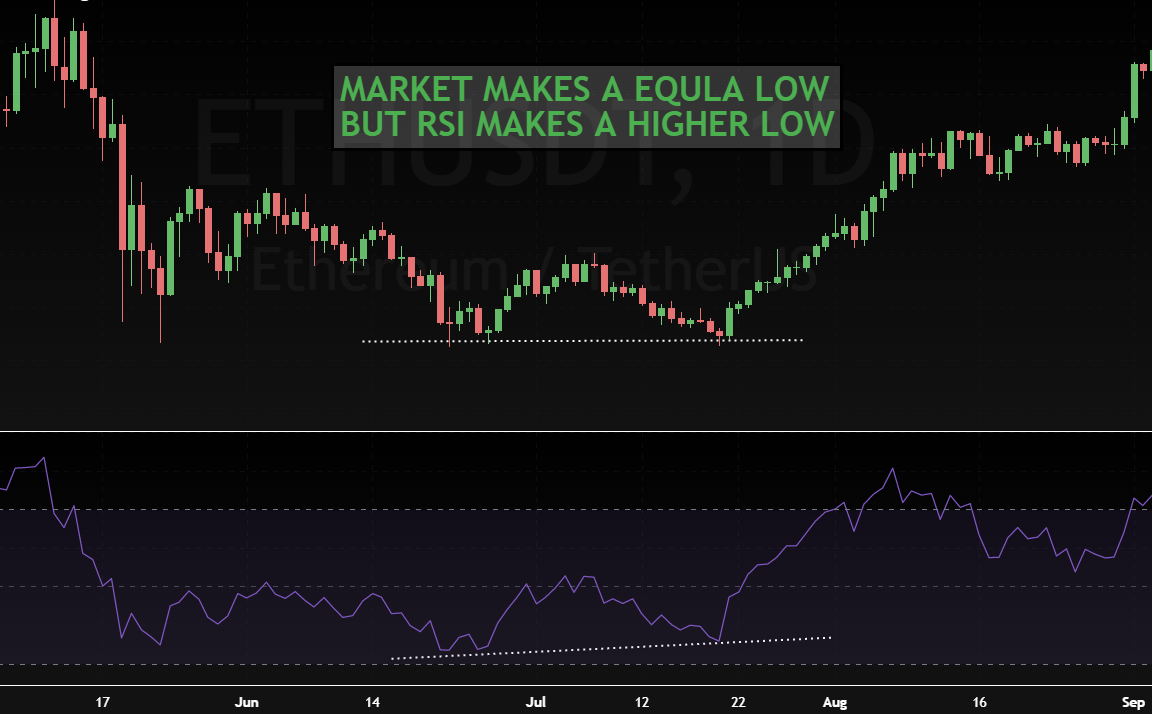
This chart shows an example of how bullish divergence can be used to predict a reversal in trend:
RSI (relative strength index) measures how strong a stock's momentum has been over a given period of time. When RSI moves above 70, it suggests that the security may be becoming overextended and could be ripe for a pullback. Conversely, if RSI falls below 30, it could indicate that the security has become oversold and is due for a rally.
A bullish divergence occurs when the RSI moves higher while the price of the asset moves lower. This suggests that there is still underlying strength in the stock, despite its current downtrend. A bullish divergence can be used to predict reversals or to confirm existing trends.
Bearish divergence, on the other hand, occurs when the RSI moves lower while the price of the asset moves higher. This usually indicates that selling pressure is increasing and that a reversal may be imminent. A bearish divergence can also be used to confirm existing trends.
What is Hidden Bullish Divergence?
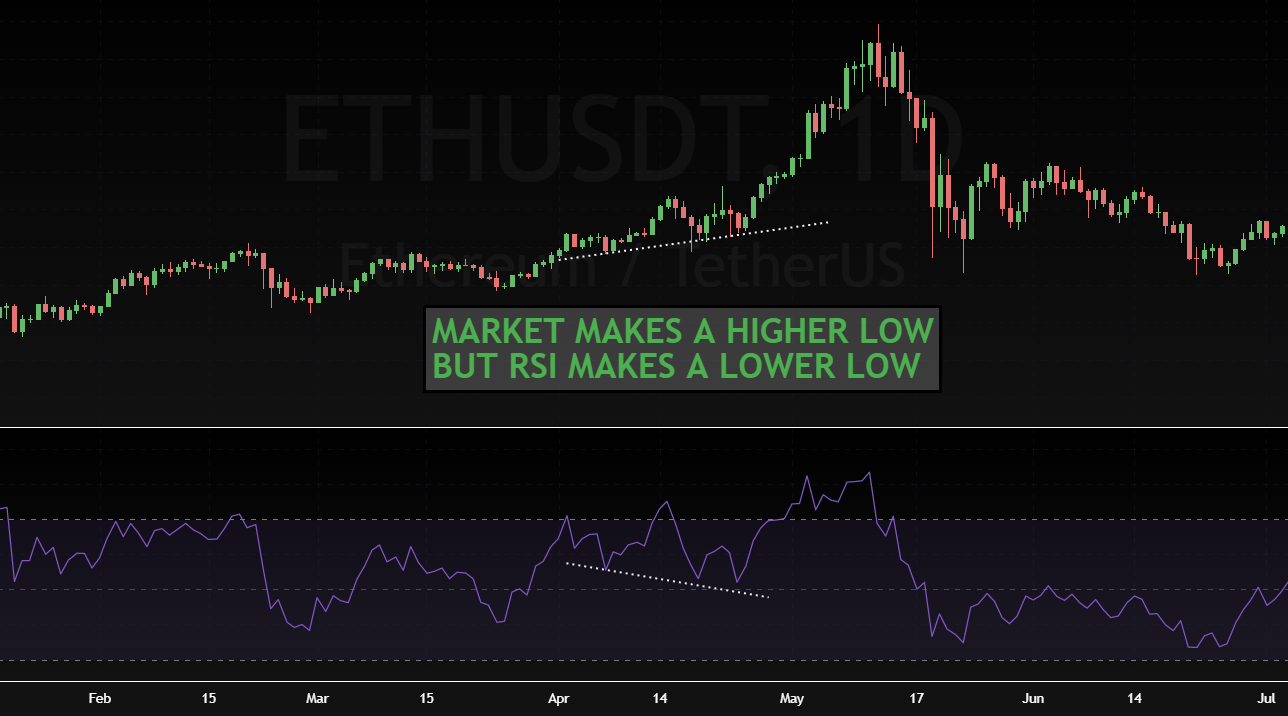
Hidden bullish divergence is a technical analysis term that is used to describe a specific type of price pattern. It occurs when the price of an asset moves higher, but the RSI (relative strength index) trend moves lower. This can be seen as a sign that the asset is oversold and may be due for a reversal.
This chart shows an example of how hidden bullish divergence can be used to predict a reversal in trend:
The bullish hidden divergence pattern can be used to identify buying opportunities in down-trending markets. When the RSI reaches oversold levels, it may be time to consider buying into the market in anticipation of a rally. However, it is important to note that this pattern should not be used as a standalone indicator - it should be combined with other technical indicators and analyzed in conjunction with overall market trends.
Moving Average Convergence Divergence (MACD)
This technical analysis indicator consists of two exponential averages oscillating around the zero line. These two lines are MACD (Moving Average Converge Divergence) and Signal.
The MACD line is the difference between a long exponential moving average and a short exponential moving average. It is generally used to detect trends in the medium and long term. A period of twenty-six days is usually used for the long average and twelve days for the short average.
The Signal line is nothing more than the exponential average of the MACD line to try to determine possible changes in its short-term trend. The histogram helps verify that the signal being emitted is true or false.
In summary, the MACD line gives us information in the medium and long term on the evolution of the value, and the Signal line gives us information on the behavior of the MACD line in the concise term.
Interpretation
This oscillator is interpreted the same as moving averages. The buy signal will occur when the signal crosses "up" (crossover) to the MACD line. The sell signal will occur when the signal line crosses "down" to the MACD line.
The most significant utility of this oscillator is to confirm that the trend will be bullish or bearish. As we have already seen, some oscillators can detect a change in the trend earlier, such as the RSI or the crossing of averages. The MACD is very useful to confirm that the trend will be strong in the medium and long term.
Difference between Regular and Hidden Divergence:
Regular Divergence: The RSI trendline is going downwards while the price trendline is increasing. This indicates a potential reversal, but it's still too early to tell because both support and resistance lines have not been broken yet. In this case, there isn't enough evidence that one will be able to break through before the end of your holding period. Regular divergences are considered as possible signals for trend reversal. On the other hand, hidden divergences signal trend continuation.
Hidden Bearish Divergence: These hidden divergence patterns move in the direction of the prevailing trend and make higher lows while prices make lower highs, indicating increased buying pressure, leading to a change in direction from down to up. You'll need both trendlines (RSI and Price) to break through their respective resistances for further confirmation, though! If only one can do so at any point throughout your holding period, you may not want to enter into a new position.
Common Mistakes Made by the trader while trading with divergences:
- The trader might not be aware of hidden divergences- bullish and bearish divergence patterns.
- The trader might trade divergences prematurely, without waiting for both trendlines to break their respective resistances.
- The trader might enter into a new position if only one trendline has broken its respective resistance (instead of waiting for both).
- The trader might use incorrect indicators while trading with divergences.
- The trader might not use a stop-loss order when trading with divergences.
- The trader might misinterpret the divergence patterns.
Conclusion
Divergence patterns can be a very effective way for traders to predict when their holding period will come to an end. In general, you'll want to look for hidden bullish divergence patterns when the RSI is making higher lows and prices are making lower highs - this typically indicates that buying pressure is increasing while selling pressure is decreasing, leading to a reversal of the trend. You'll also need both trendlines (RSI and Price) to break through their respective resistances to confirm the pattern. If only one line breaks its resistance, it's still too early to enter a new position. Using incorrect indicators or misinterpreting divergence patterns can lead to costly mistakes, so always be sure to do your research before entering any trade!
Trade with us!
If you're looking for a more sophisticated and educational options trading experience, look no further than "Market Moves Premium Options Trading Group." Our exclusive 7-day membership offers swing trading set-ups, fast text signals, and +100 hours of educational content. Plus, you'll have access to live trading sessions twice per day. So if you're ready to take your options trading to the next level, join us today!
Financial Disclaimer: Market Moves LLC is a company that provides education in financial and stock market literacy. WE ARE NOT FINANCIAL ADVISORS. It is illegal for us to give any financial advice to you. Under U.S. law, the only persons who can give you financial advice are those who are licensed financial advisors through the SEC. Results shown from Market Moves LLC or customers who use our product and or service are individual experiences, reflecting real-life experiences. These are individual results, and results do vary. Market Moves LLC does not claim that they are typical results that consumers will generally achieve. Past performance does not guarantee future results. You should not rely on any past performance as a guarantee of future investment performance


![8 Single Stock Leveraged ETFs [Brand New]](https://tradewithmarketmoves.com/uploads/images/2022/09/image_380x226_63135e79c0e8f.jpg)


