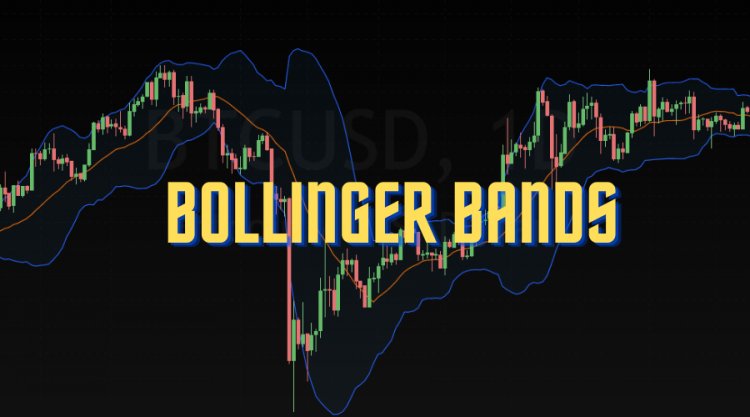
Bollinger Bands - Everything You Need To Be Aware Of!
A fascinating invention by John Bollinger which will aim to give you the upper hand in identifying price movements and market volatility.

Bollinger Bands - Everything You Need To Be Aware Of!
Meta description: A fascinating invention by John Bollinger which promises to give you the upper hand in identifying price movements and market volatility.
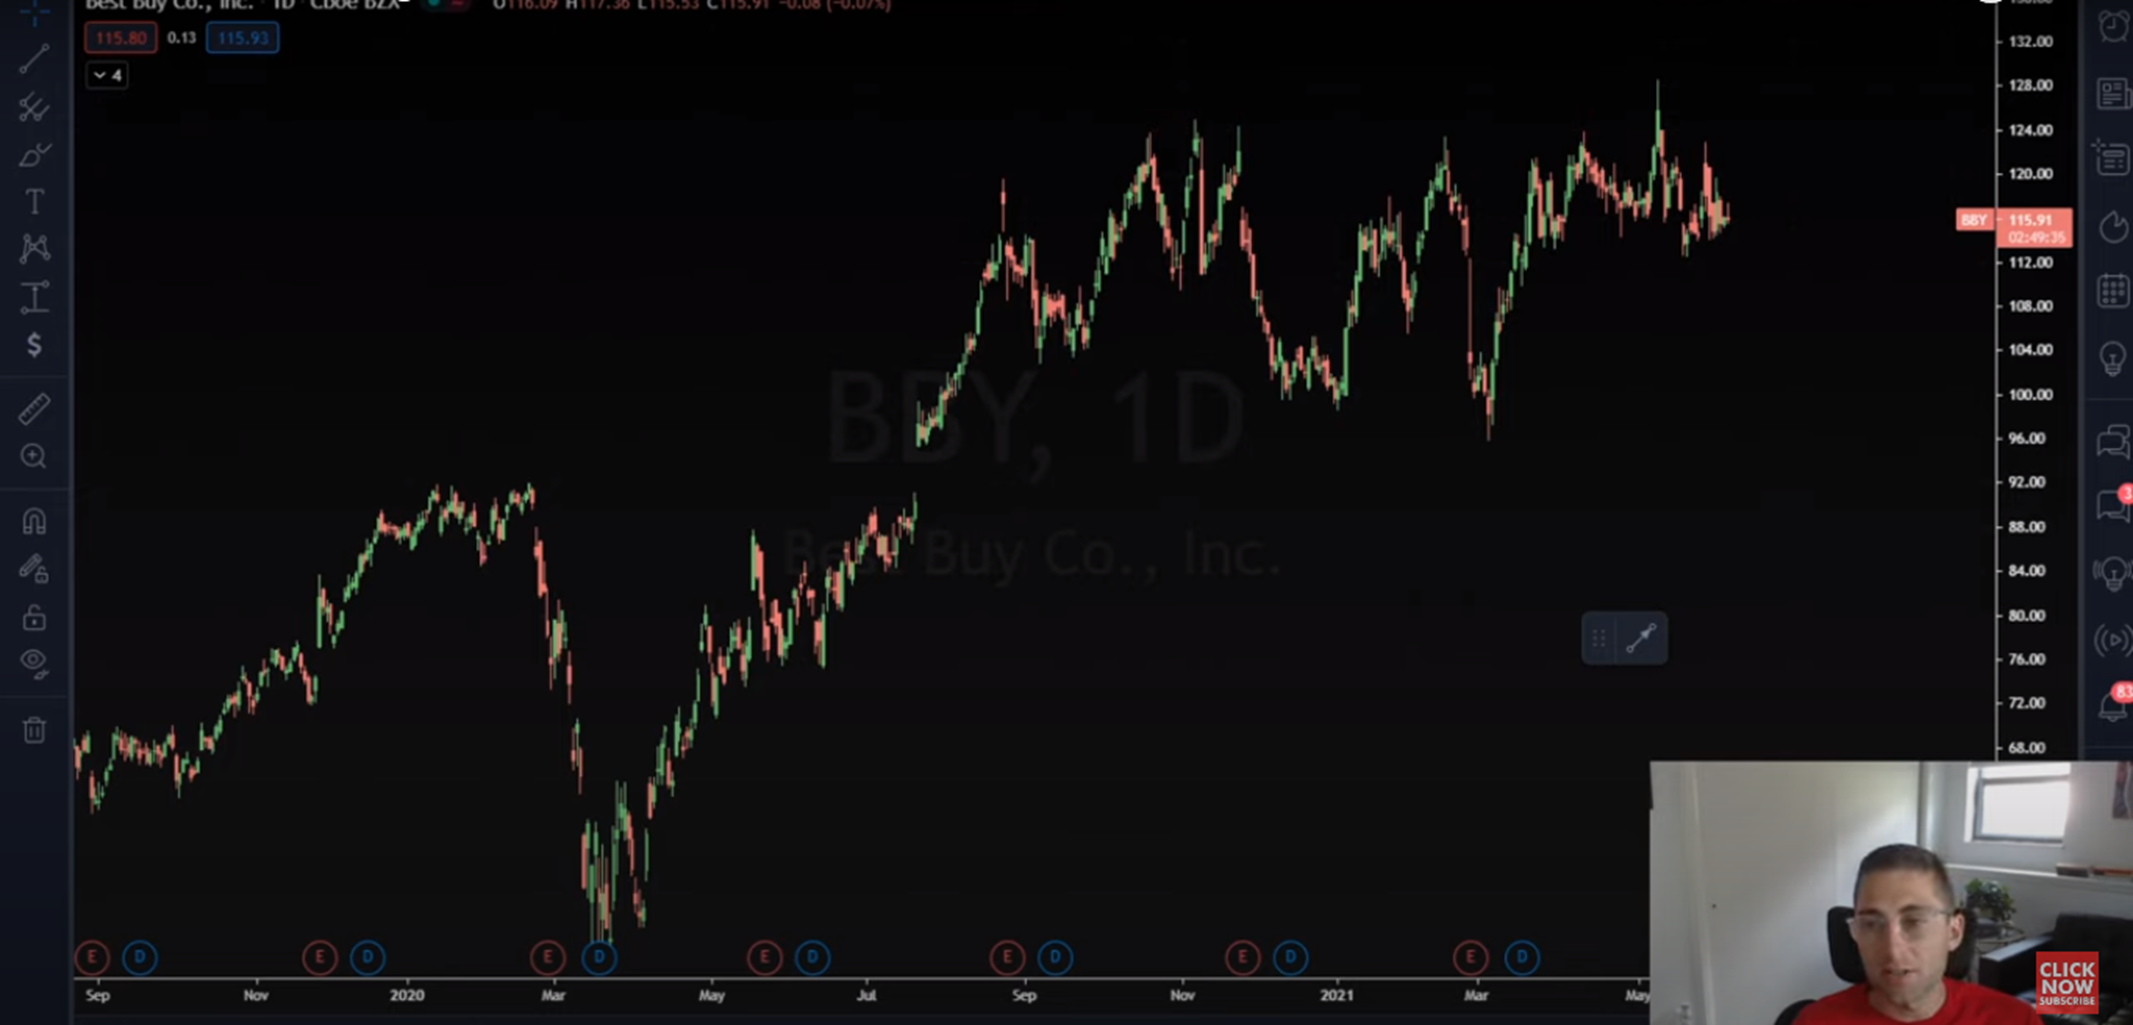
Bollinger Band is a technical analysis tool developed for technical analysis. This has become a fascinating tool in the market and is renowned for its unique capabilities, including assessing price volatility and prices in general. This intriguing invention was developed by John Bollinger in the 1980s and has been the subject of immense praise.
How are Bollinger Bands calculated?
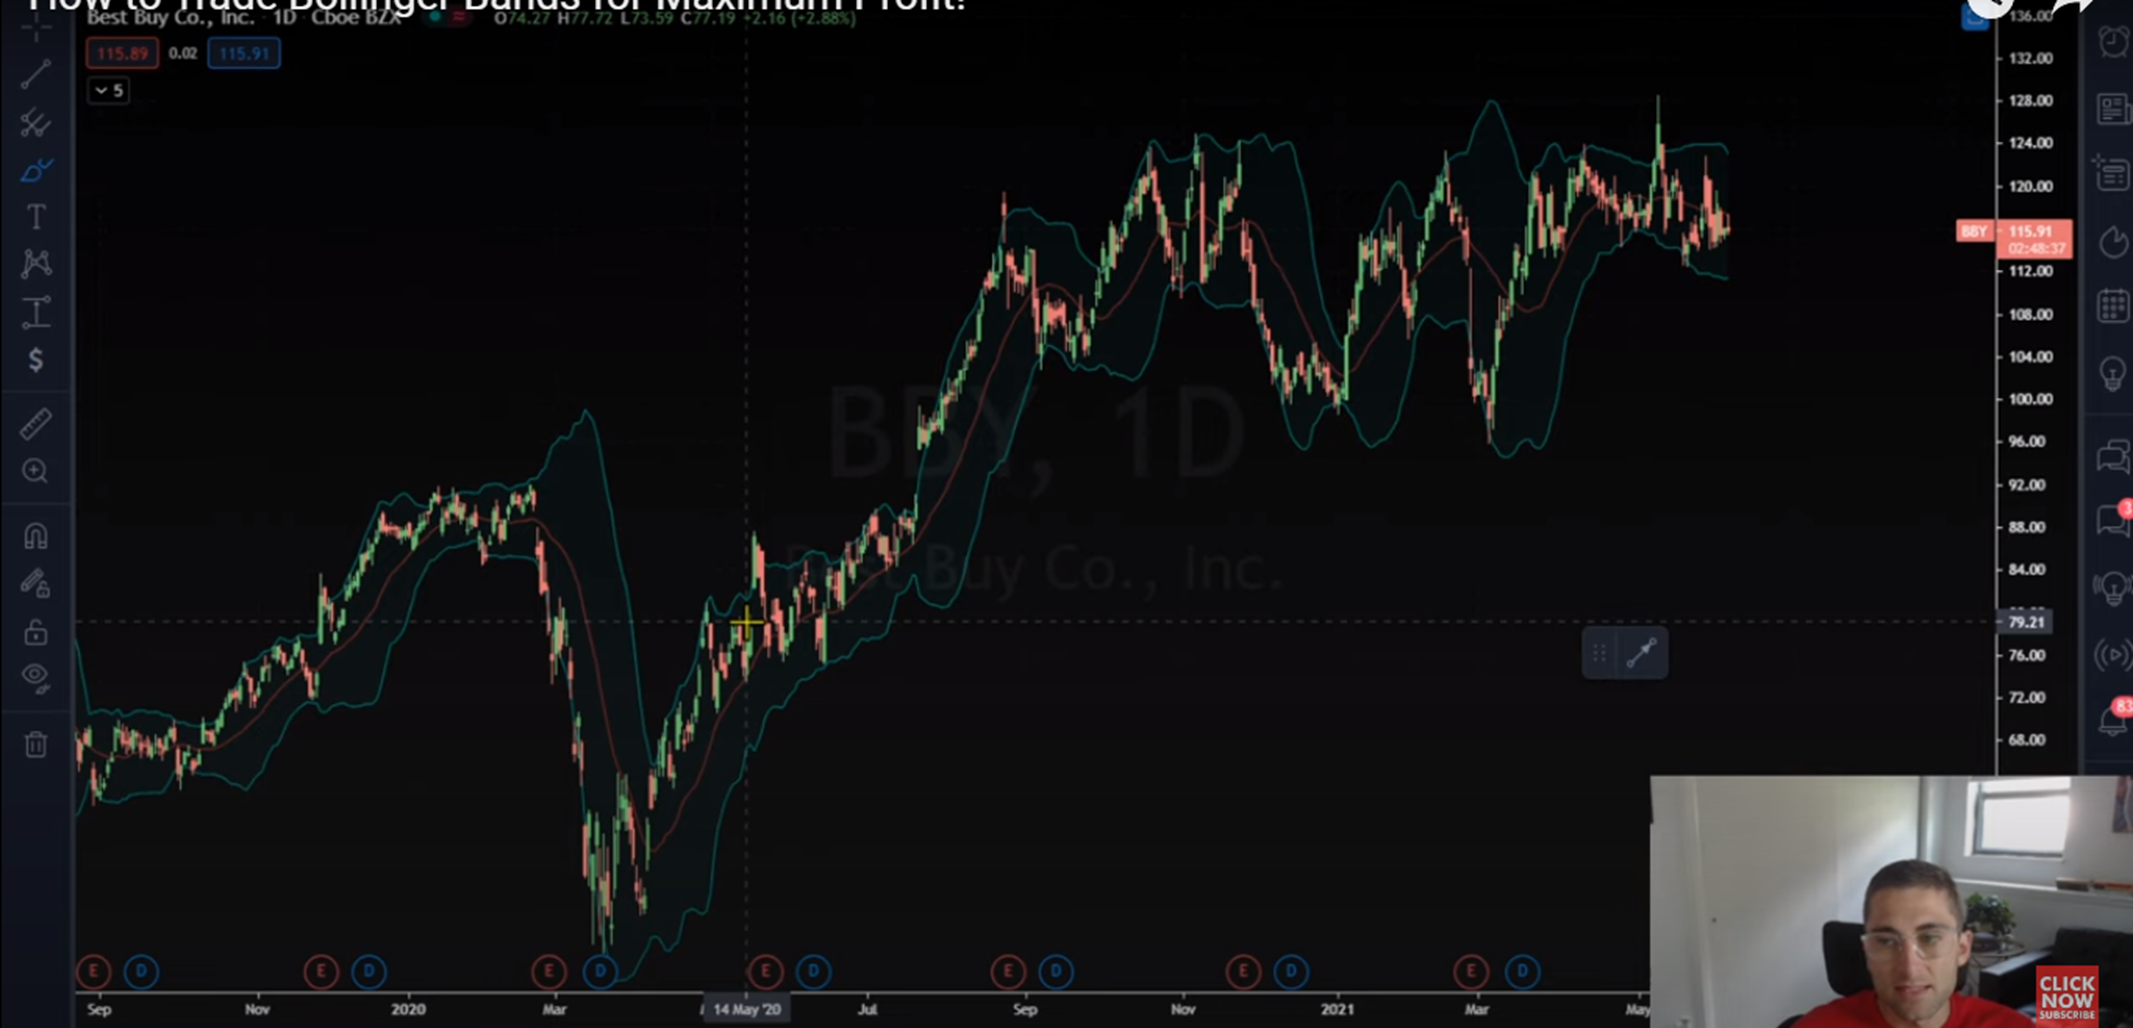
The Bollinger Bands have three lines. The simple calculation makes use of a Simple Moving Average, which spans 20 days. On the other hand, the upper band is calculated by making use of the middle band and then adding it to twice the number of standard deviations of that amount.
Hence, this results in a lower band calculation with the help of the middle band, in which twice the amount of standard deviation will be subtracted.
How do you interpret the Bollinger Bands?
Traders of Bollinger Bands are free to use them as they wish. When the prices touch the lower bands, there will be more incentive to buy them than when the prices are on the moving average located in the bands' center. Here, rather than expanding volume, some of the reactions of traders will shift in the opposite direction, and they will look forward to exiting.
Another thing to denote here is that when the bands lie together in close proximity, this indicates that volatility decreases. However, when the bands expand, there is an increase in price action.
In addition to the above, there are basically the three lines, which are inclusive of the upper band, the lower band, and the middle band, which end up showcasing the price movements, as well as the price action during trading.
Moreover, we would like to add that though we are analysts who are aware of how the market works with these indicators, we are not your financial advisors, which is why whatever we do say should be corroborated by your own research as well.
We are people who are trying to learn how the market moves, and we understand that we still have a great way to go. However, we do like giving our followers information regarding technical indicators and how they, such as the Bollinger Bands vary. But, please do not consider this as Gospel. Having said that, let us now look at how:
What do the upper and lower bands tell you in a Bollinger Band?
While using Bollinger Bands, one thing that happens is variation. The Bollinger Bands vary; many traders believe that when the price touches the upper band, this means that the market is more overbought. However, if the price touches the lower band, that means the market at the moment is oversold.
John Bollinger himself has a set of approximately 22 tules he followed when he was engaged in trading these bands in the financial markets. The key here is to understand the use of Bollinger Bands, after which you will be able to utilize it to your advantage.
Something to pay attention to is the concept of volatility -standard deviation is a measurement of volatility - therefore, when there is high volatility, the bands widen, and simultaneously, when there is low volatility.
Contextualizing the Trend of Bollinger Bands:
Generally, there is a trend in the market when indicators such as the moving average, the MACD, or the RSI are being pulled up in a specific direction.
In essence, when there is a downtrend and the price touching is done in the middle, it is a great entry point. However, the idea is mostly to play around either the upper band or the lower band.
Bollinger Bands are also known as volatility bands because this is how they send trading signals. If, for instance, the stock's price is highly volatile, then the difference which the Bollinger Band will have a large difference from top to bottom.
But, if the volatility is low, then there is a small difference from the top to the bottom. Hence, if the Bollinger Band is tight, then, as an options trader, there may be high risk involved, and the likely option is that one made end up losing money.
Assessing whether to enter from the Middle Band or the Lower Band:
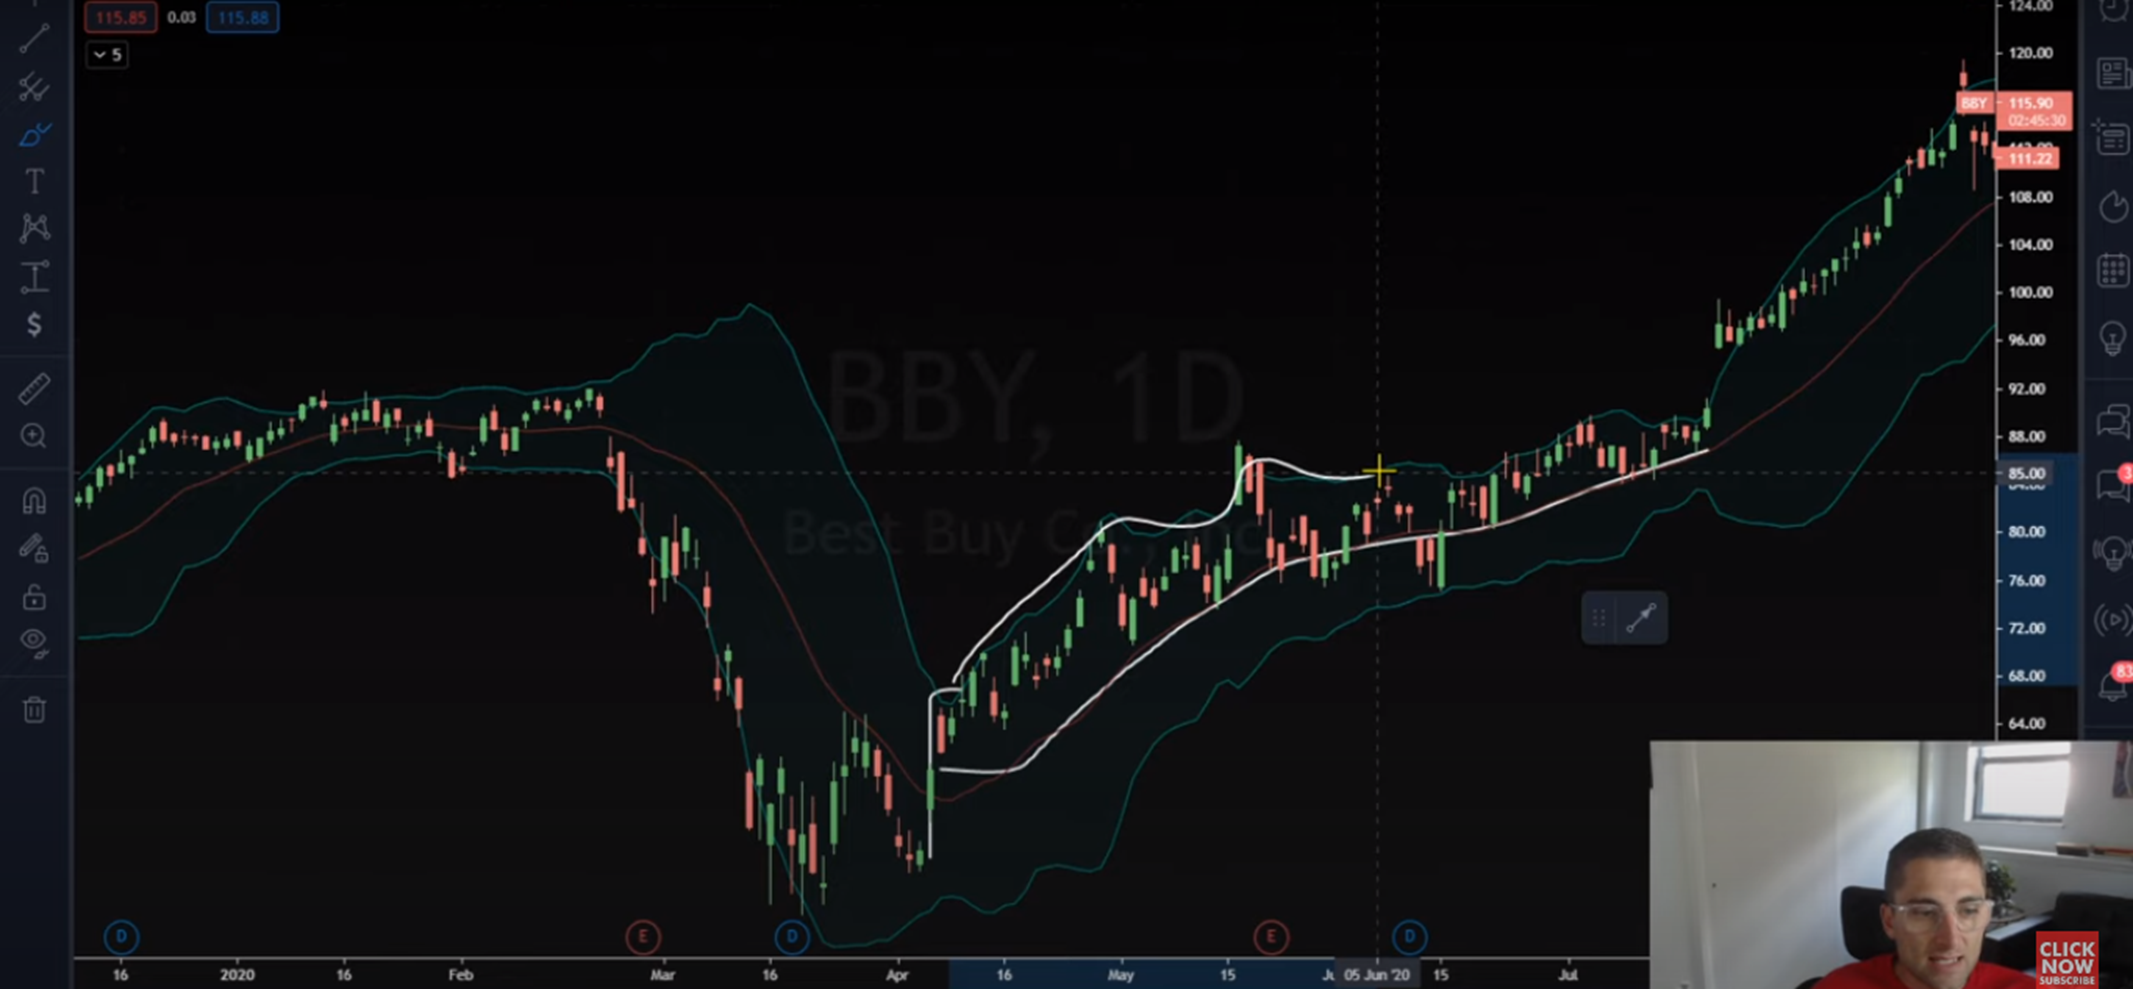
If there is a strong trend, a good way to enter is through the middle band (known as the mid-entry point). Additionally, if you get a lower Bollinger Band touch, that is the better entry point for you.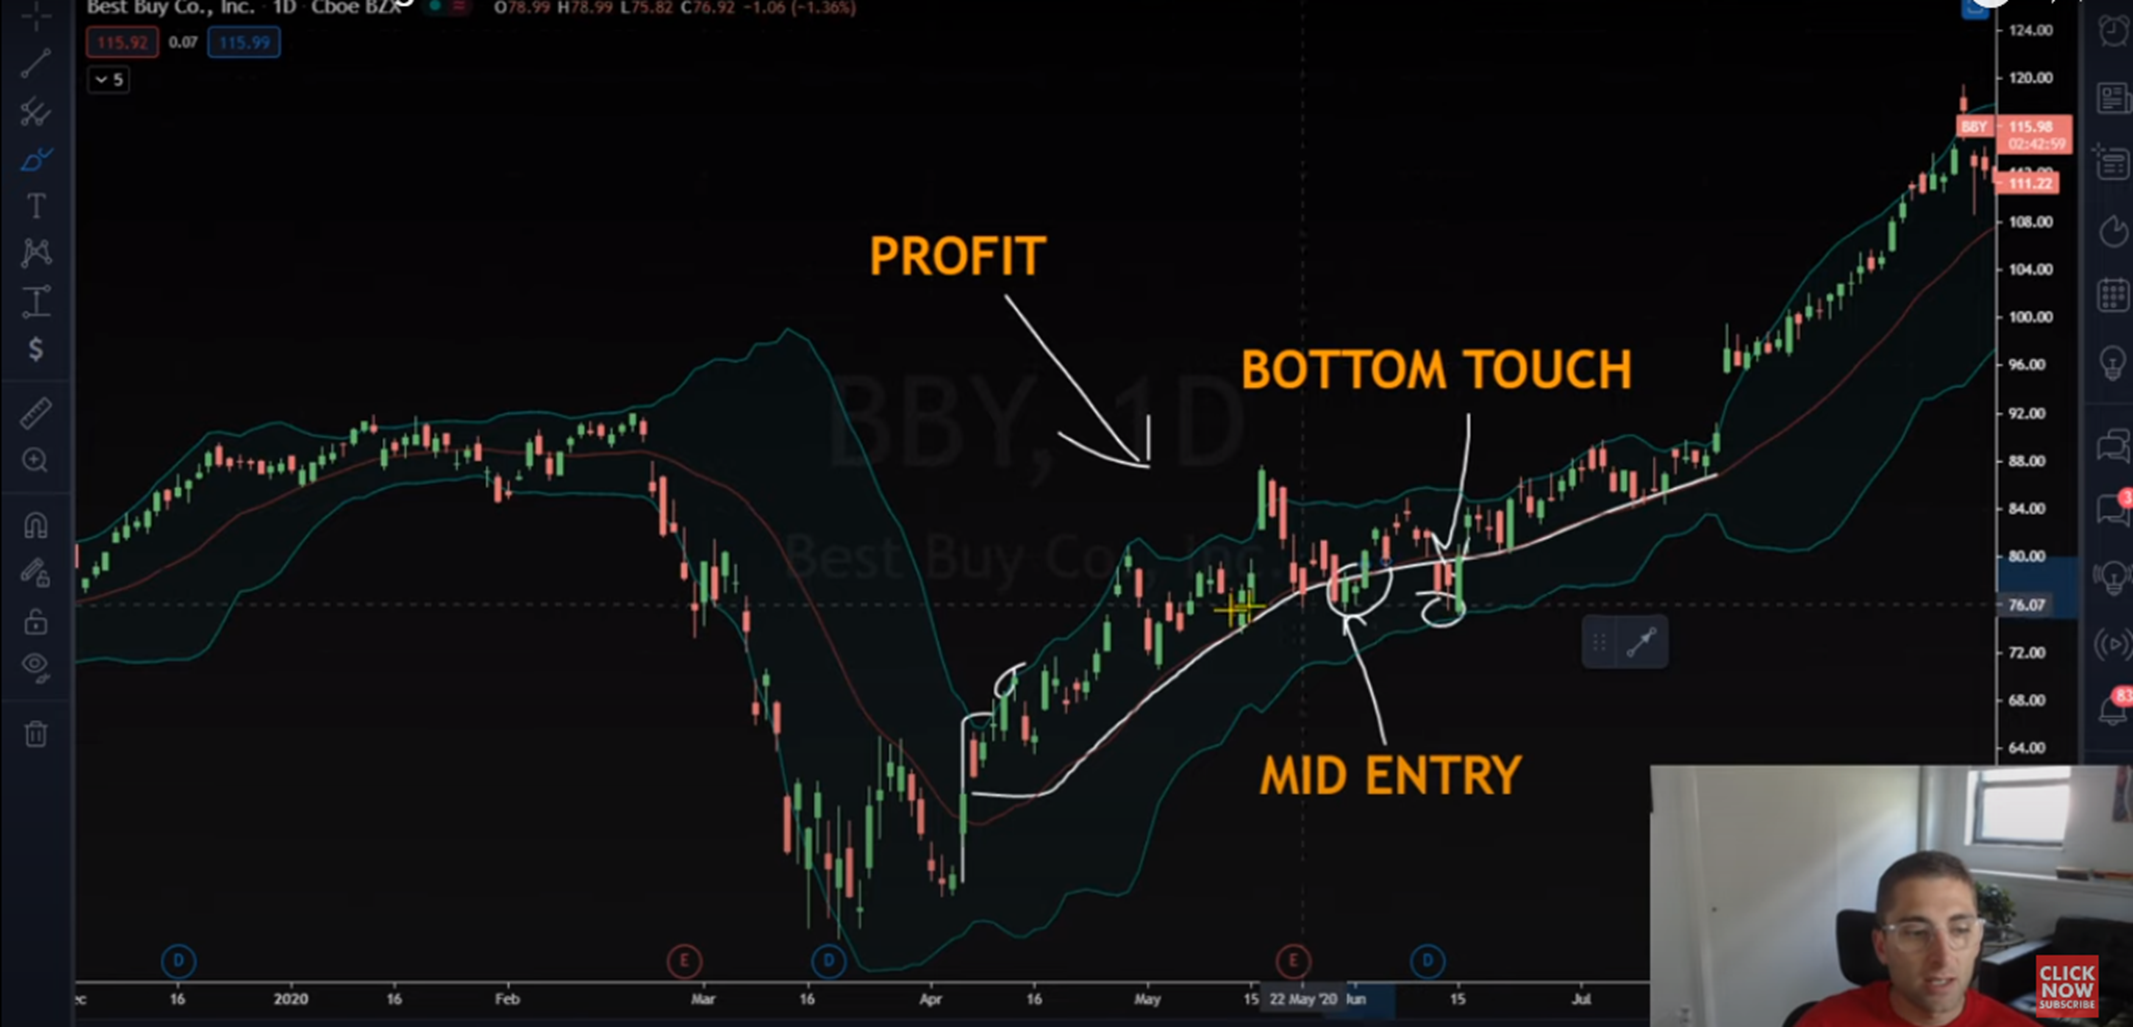
Scrutinizing the Chop of Bollinger Bands:
The chop, also known as the time decay of Bollinger Bands, is another component you need to be aware of before finalizing your investment decisions and going with the sale of that particular security.
If there is this much chopping, then the likelihood is that the higher time frames here have a tight channel of price action.
Moreover, if there are Bollinger Bands, which end up becoming very flat, then the likelihoods that the price action there appears to be quite stagnant, and therefore not very appealing.
The thing is that with flat Bollinger Bands, the price moves nowhere. It is pretty much just there, and that's it.
However, if we look at another scenario, then notice how the extension in the Bollinger Band below is quite wide.
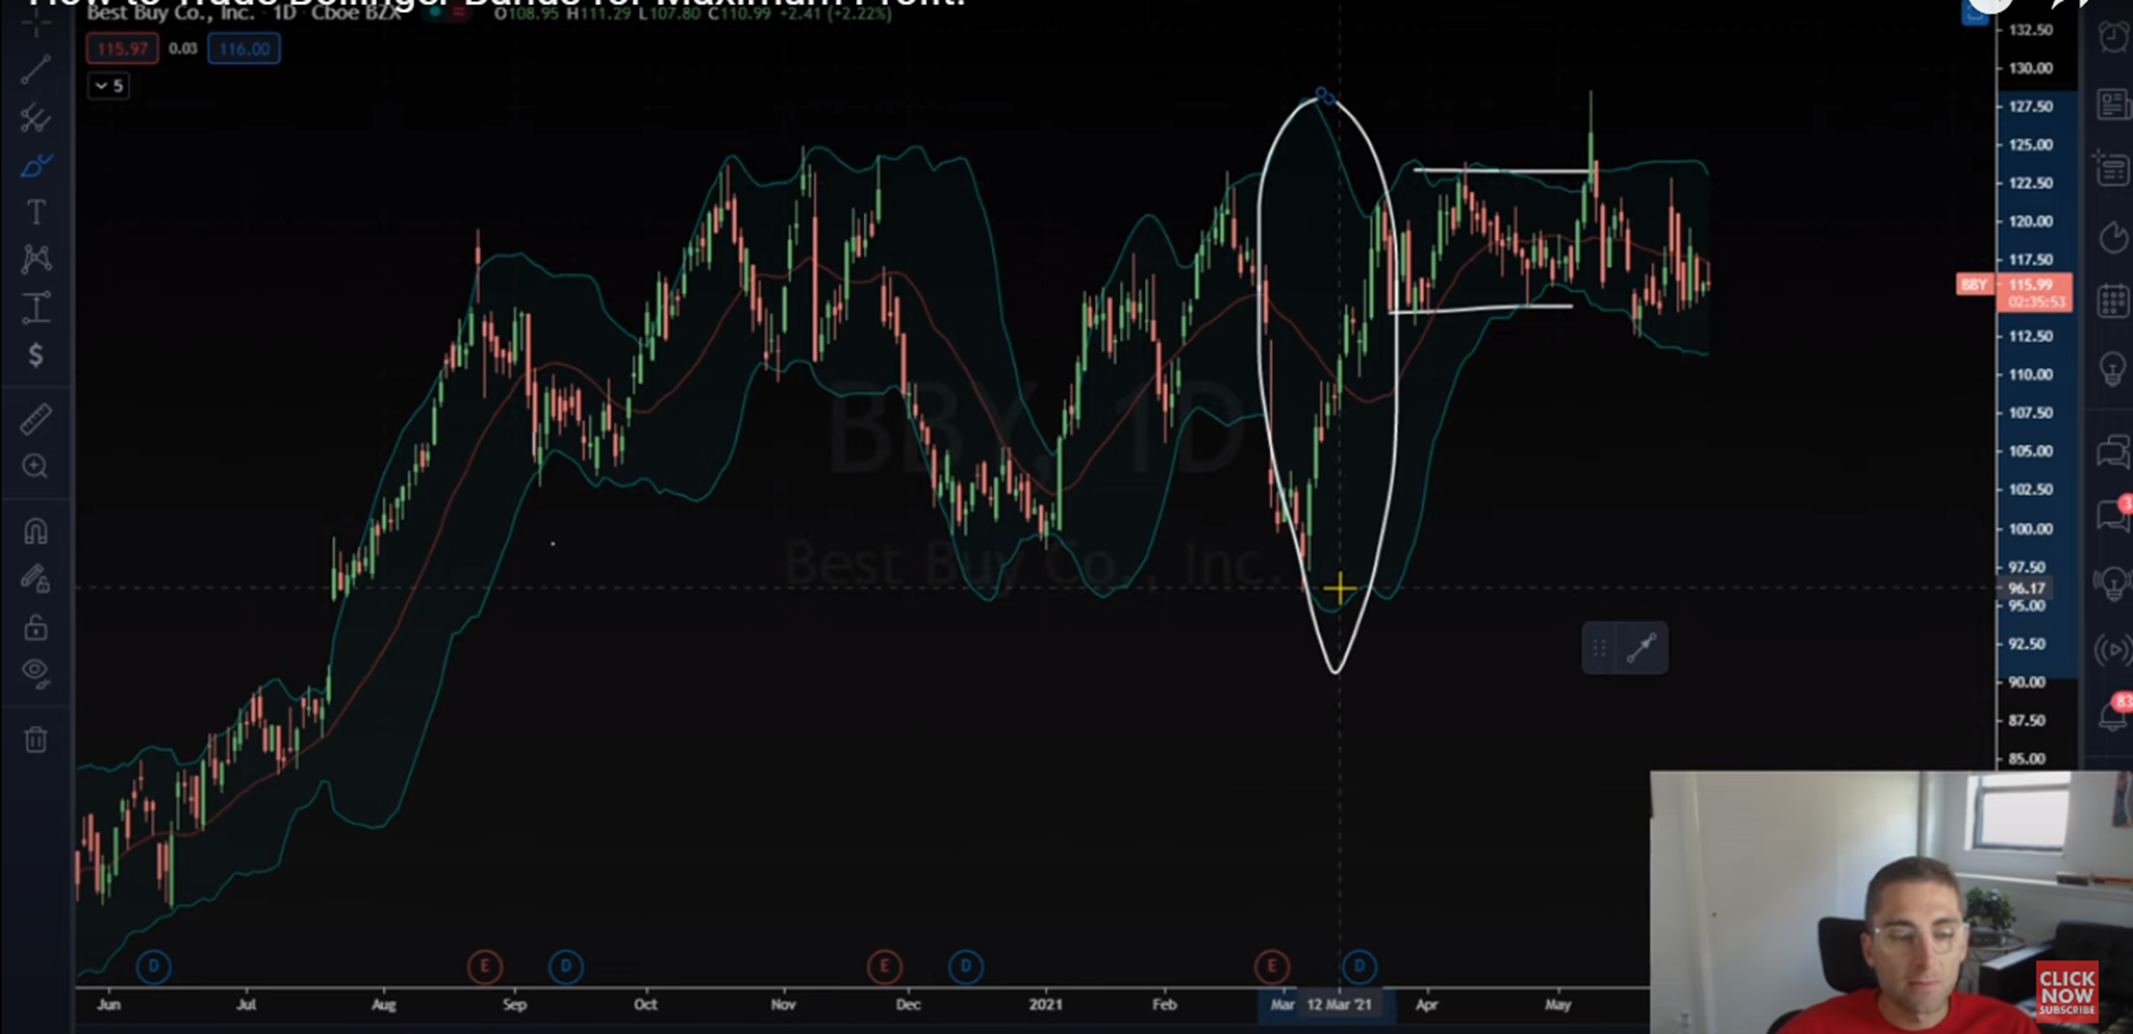
What this means is that there is a large move of a chop. The image showcases a chop of almost 30 points, which is highly useful from the perspective of the trader.
The key tip here is to be aware of the warning sign. The way we usually trade is by looking at the size of the Bollinger Bands. If it isn't at least 10%, it is better to avoid this and wait until the buy signal is clearly in your favor.
This then brings us to another key concept which is on:
The squeezing of the Bollinger Bands:
The squeeze strategy of this momentum indicator occurs when the price illustrates its dynamic nature by first moving aggressively and then sideways.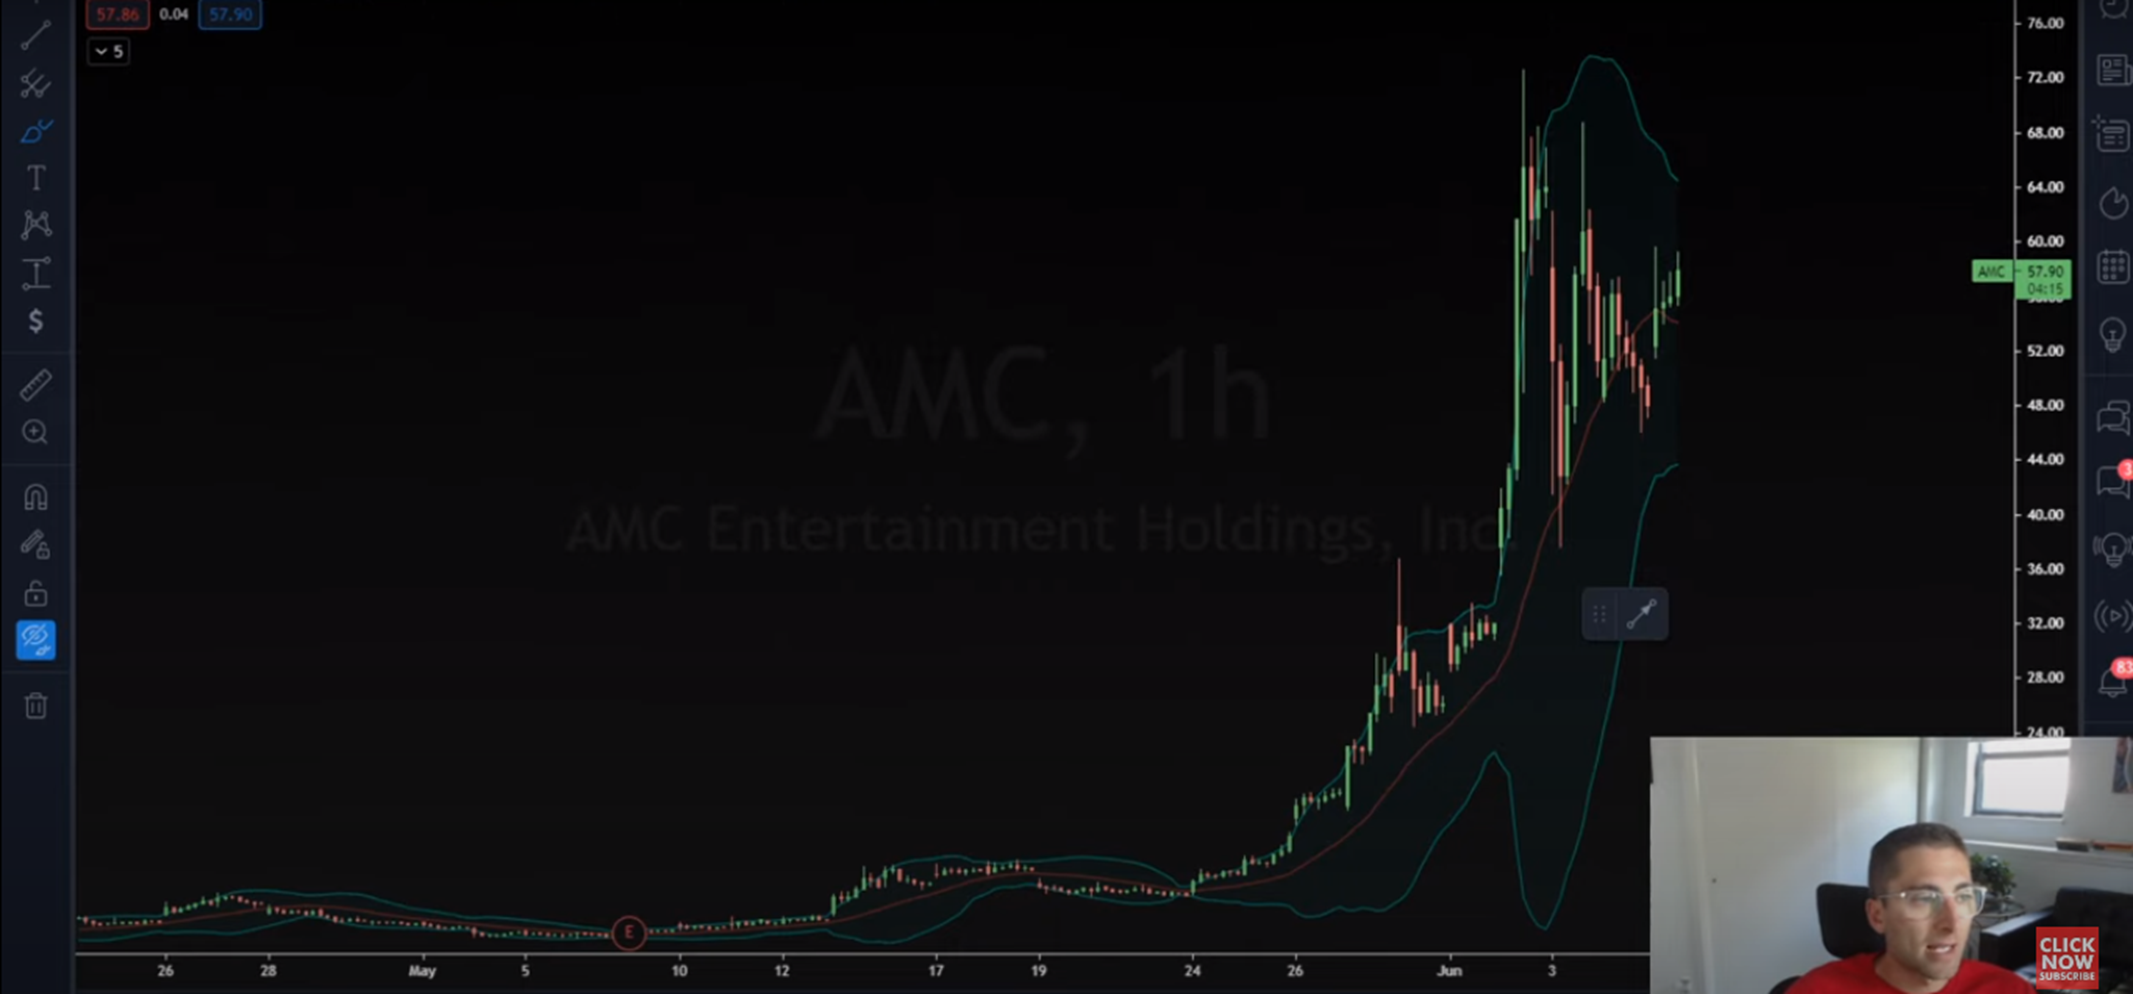
Now for a trader, the typic values of assessing the basic form of the Upper Bollinger Band, the middle Bollinger Band or the Lower Bolinger Band is through their tops and bottoms. This was included in Arthur Merrill's work, and what it meant was to identify w bottoms or to identify m tops to see the trend of Bollinger Bands.
A security's price is set to consolidate (decrease in volatility) if the upper and lower band are seen to be working closely together. After some time period, the price will either in one direction, which could signal an expanding volume. This could be a signal that traders are betting on the price moving in a breakout direction.
What does the Price break through the upper band or lower band signals?
When there is a price break, that signals to the trader to either buy more of the asset or sell it.
The chart illustrates a 112% drop in the prices, which has the added incentive for traders who want to engage in buying or selling. The fact that this drop is so massive is why larger Bollinger Bands, in essence, seem to be highly attractive because the risk tolerance is low, and the benefit is high.
Do Bollinger Bands work in Cryptocurrency trading?
The short answer to this is indeed in the affirmative. Bollinger Bands work seamlessly with stocks and in the crypto world as well. These bands are a visual indicator that gives an estimate of the asset's volatility with ease. In addition to the above, it only needs three lines to get the job done, which are the lower band, the upper band, and the middle band.
Hence, these bands have a stream of benefits that they have to offer to their users without any hindrances. Albeit they aren't recommended for projected prices, but when it does come to whether they can be useful in endowing you with numerous trading benefits and making it easier to keep track of prices, then they do work great.
Now that we have dealt with the above in a highly in-depth discussion, one question which our members and prospective members ask us is:
What is meant by the Trend Reversal:
A trend reversal occurs when the spot falls outside the bands, and this is also known as "breaking the bands."
Breaking the bands frequently occurs, especially when there is extreme volatility because here is where you will expect the trend reversal to be the most imminent.
The Bottom Line: Bollinger Bands Are Impeccable In illustrating Volatility Increases and Acting as a Momentum Oscillator!
Bollinger Bands can be used for multiple reasons. One of them even begins to showcase the quantity of overbought and oversold signals. However, traders are also free to use other default parameters in conjunction with these bands. The typical values displayed can assess how the security price falls, moves, and performs.
Moreover, as the Bollinger Bands consist of the upper and lower bands and strive to provide an accurate technical analysis, even when put together with other indicators, it is safe to say that using Bollinger Bands can be a great way to start your trading journey.
Additionally, it is highly recommended for beginners, who need information regarding the new price and other security prices on a relative basis, to make their trading decisions.
Frequently Asked Questions (FAQS):
Some questions that are audience tends to ask us is:
What should I set my Bollinger Bands to?
They are usually set at a 20-period moving average, where the period could be set at around 5 minutes, to an hour, or even an entire day. Hence, the upper and lower bands are set to two standard deviations above and the moving average below it.
What are the 2 standard deviations in Bollinger Band?
Whenever you attempt to make use of Bollinger Bands, ensure that it is at least within 95%, and all trading activity should be at least within this limit.
What happens when Bollinger Bands are narrow?
If these bands are too narrow, then that means that the price has fallen to relatively lower levels.
What is a BB indicator?
The BB indicator showcases the closing price relative to the bands. These bands are plotted around a 20-day simple moving average at a fixed percentage of 95% (2), the number of standard deviations.
Are Bollinger Bands predictive?
Bollinger Bands will give you an insight into the trends and use the simple moving average, the lower Bollinger Band, and the Upper Bollinger Band to exhibit results. However, it does not give a prediction regarding prices. You can check past performance with it, but if the aim is to project future prices, this does not align with what the bands are meant to do.
Trade with us!
If you're looking for a more sophisticated and educational options trading experience, look no further than "Market Moves Premium Options Trading Group." Our exclusive 7-day membership offers swing trading set-ups, fast text signals, and +100 hours of educational content. Plus, you'll have access to live trading sessions twice per day. So if you're ready to take your options trading to the next level, join us today!
Financial Disclaimer: Market Moves LLC is a company that provides education in financial and stock market literacy. WE ARE NOT FINANCIAL ADVISORS. It is illegal for us to give any financial advice to you. Under U.S. law, the only persons who can give you financial advice are those who are licensed financial advisors through the SEC. Results shown from Market Moves LLC or customers who use our product and or service are individual experiences, reflecting real-life experiences. These are individual results, and results do vary. Market Moves LLC does not claim that they are typical results that consumers will generally achieve. Past performance does not guarantee future results. You should not rely on any past performance as a guarantee of future investment performance


![8 Single Stock Leveraged ETFs [Brand New]](http://tradewithmarketmoves.com/uploads/images/2022/09/image_380x226_63135e79c0e8f.jpg)